Sales Dashboard: Difference between revisions
From Fishbowl Advanced
No edit summary |
No edit summary |
||
| Line 1: | Line 1: | ||
{{Module Introduction|Sales Dashboard|Sales}} | {{Module Introduction|Sales Dashboard|Sales}} empowers businesses to make informed decisions by providing a clear picture of sales performance. By having access to real-time data, businesses can quickly identify trends, optimize pricing strategies, and improve customer satisfaction, ultimately leading to increased revenue and growth. | ||
* | {{IntroImage}} | ||
* | |||
== Key Features == | |||
* Sales Orders vs. Previous Period: Easily compare current sales performance against historical data to identify trends and areas for improvement. | |||
* Sales Order Summary: Access a comprehensive overview of all sales orders, including key metrics such as total sales, average order value, and order volume. | |||
* Margins: Quickly analyze profit margins across different products and sales channels to optimize pricing strategies. | |||
* Top Selling Products: Identify which products are driving the most revenue to focus marketing and inventory efforts effectively. | |||
* Sales by Product Tree: Understand sales performance across your product categories and hierarchies for strategic decision-making. | |||
* Orders Fulfilled in Full on Time: Track the percentage of orders fulfilled on time, helping to improve customer satisfaction and operational efficiency. | |||
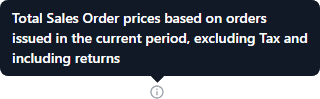
* Click any of the {{Icon Button|Information|4=icons}} for more details.<br>[[File:Sales Dashboard i.png]] | * Click any of the {{Icon Button|Information|4=icons}} for more details.<br>[[File:Sales Dashboard i.png]] | ||
Latest revision as of 08:24, 13 August 2024
![]() The Sales Dashboard module, located in the
The Sales Dashboard module, located in the ![]() Sales group, empowers businesses to make informed decisions by providing a clear picture of sales performance. By having access to real-time data, businesses can quickly identify trends, optimize pricing strategies, and improve customer satisfaction, ultimately leading to increased revenue and growth.
Sales group, empowers businesses to make informed decisions by providing a clear picture of sales performance. By having access to real-time data, businesses can quickly identify trends, optimize pricing strategies, and improve customer satisfaction, ultimately leading to increased revenue and growth.

Key Features
- Sales Orders vs. Previous Period: Easily compare current sales performance against historical data to identify trends and areas for improvement.
- Sales Order Summary: Access a comprehensive overview of all sales orders, including key metrics such as total sales, average order value, and order volume.
- Margins: Quickly analyze profit margins across different products and sales channels to optimize pricing strategies.
- Top Selling Products: Identify which products are driving the most revenue to focus marketing and inventory efforts effectively.
- Sales by Product Tree: Understand sales performance across your product categories and hierarchies for strategic decision-making.
- Orders Fulfilled in Full on Time: Track the percentage of orders fulfilled on time, helping to improve customer satisfaction and operational efficiency.
- Click any of the
 Information icons for more details.