Report MTD Sales Bar Graph: Difference between revisions
From Fishbowl Advanced
m (Text replacement - ".png|right|border|400px|link={{filepath" to ".png|border|800px|link={{filepath") Tag: Reverted |
m (Text replacement - ".png|border|800px|link={{filepath" to ".png|right|border|800px|link={{filepath") Tag: Reverted |
||
| Line 1: | Line 1: | ||
{{BackToReports}} [[File:Report-MTD Sales Bar Graph.png|border|800px|link={{filepath:Report-MTD Sales Bar Graph.png}}]] This report displays a bar graph of total gross sales for the current month. This report is most commonly used in the Reports gadget in the Dashboard module. | {{BackToReports}} [[File:Report-MTD Sales Bar Graph.png|right|border|800px|link={{filepath:Report-MTD Sales Bar Graph.png}}]] This report displays a bar graph of total gross sales for the current month. This report is most commonly used in the Reports gadget in the Dashboard module. | ||
The {{Button|Modify Report}} allows the following report filters to be customized:<br> | The {{Button|Modify Report}} allows the following report filters to be customized:<br> | ||
{{Spacer}}'''OPTIONAL TAB''' | {{Spacer}}'''OPTIONAL TAB''' | ||
Revision as of 21:38, 12 March 2025
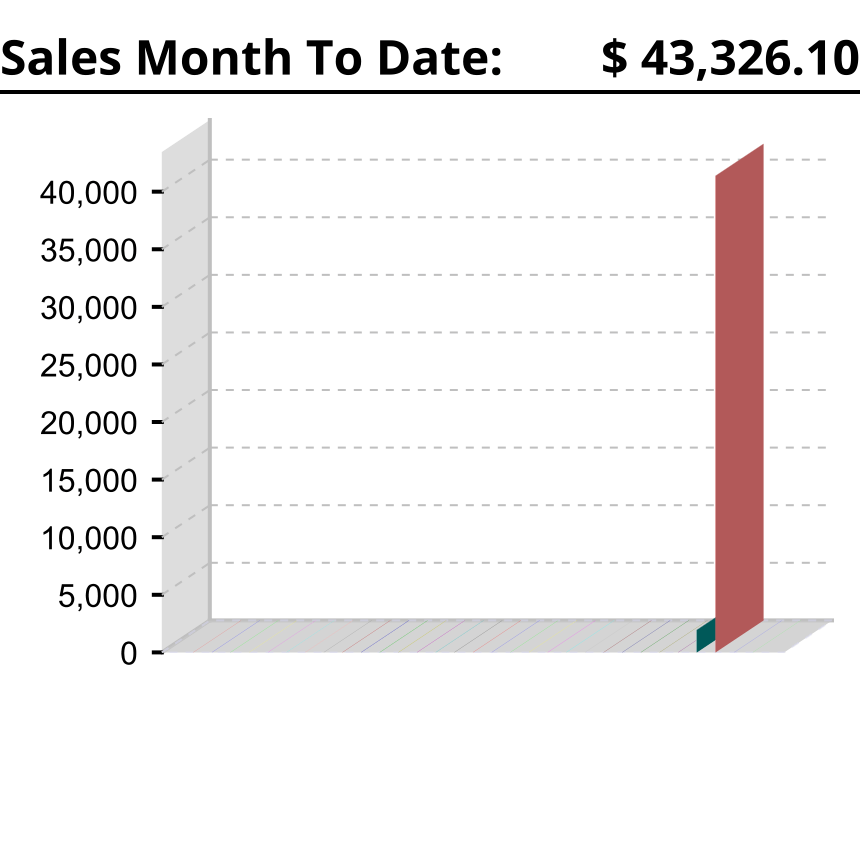
This report displays a bar graph of total gross sales for the current month. This report is most commonly used in the Reports gadget in the Dashboard module.
The  Modify Report button allows the following report filters to be customized:
- OPTIONAL TAB
- Format Report for Exporting - Removes the page breaks and displays the report on one long page for exporting to CSV, Excel, and other formats.
- PRINTER TAB - Allows a default printer to be specified for the report in each location group.