Report Pick Efficiency
From Fishbowl Advanced

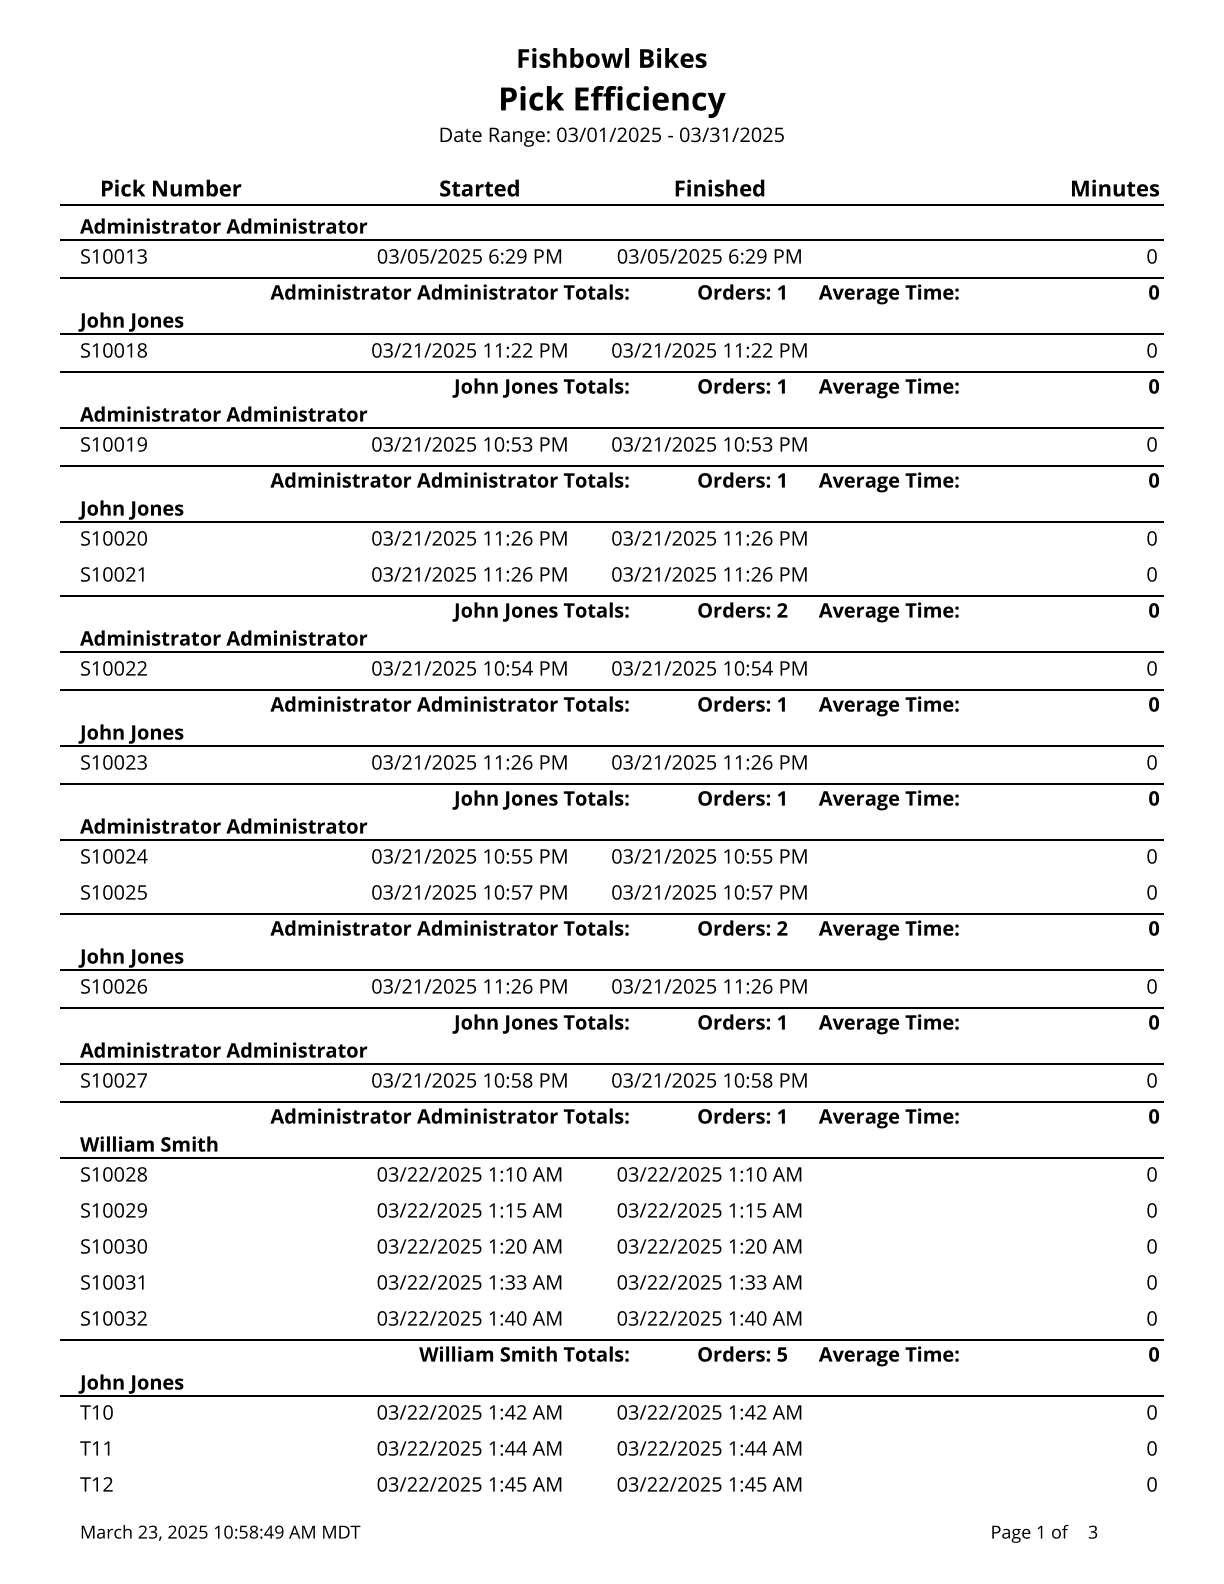
This report displays the efficiency of each pick order, grouped by user.
The  Modify Report button allows the following report filters to be customized:
- OPTIONAL TAB
- User - Enter the username of the user to run the report for. Leave this field blank to run for all users.
- Date Finished In the Date Range - Select the date range to see information for. This date range looks at the DateFinished on the PICK table in the database, meaning the date the pick was finished.
- Format Report for Exporting - Removes the page breaks and displays the report on one long page for exporting to CSV, Excel, and other formats.
- Show Details - Choose to show/hide specific picking order information by checking/unchecking this checkbox.
- PRINTER TAB - Allows a default printer to be specified for the report in each location group.