Report MTD Sales Bar Graph
From Fishbowl Advanced
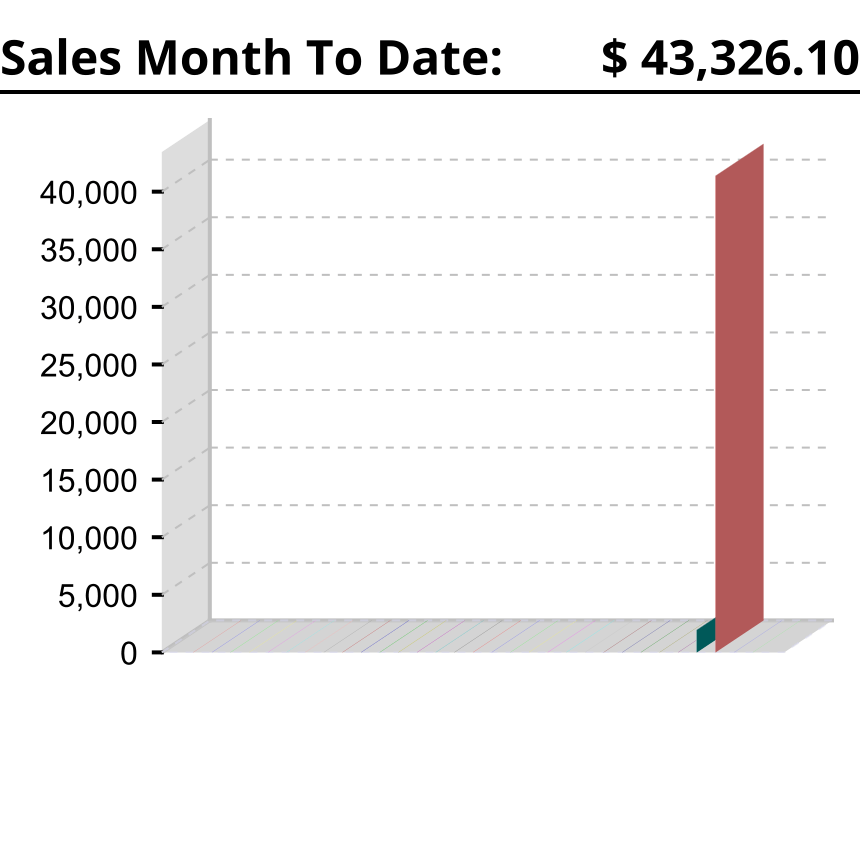
This report displays a bar graph of total gross sales for the current month. This report is most commonly used in the Reports gadget in the Dashboard module.
The ![]() Modify Report button allows the following report filters to be customized:
Modify Report button allows the following report filters to be customized:
- OPTIONAL TAB
- Format Report for Exporting - Removes the page breaks and displays the report on one long page for exporting to CSV, Excel, and other formats.
- PRINTER TAB - Allows a default printer to be specified for the report in each location group.