Total Item Sales Report
Fishbowl Drive has its very own T.P.S Report. This report generates a list of gross sales for the date range specified, ordered from greatest to least. An empty date range will produce an empty report. T.P.S normally stands for Total Product Sales, and the lack of a third period is deliberate. Since there are no products in Fishbowl Drive, only items, the report’s name was changed to Total Item Sales. But we kept the abbreviation the same.
←Back to list of reports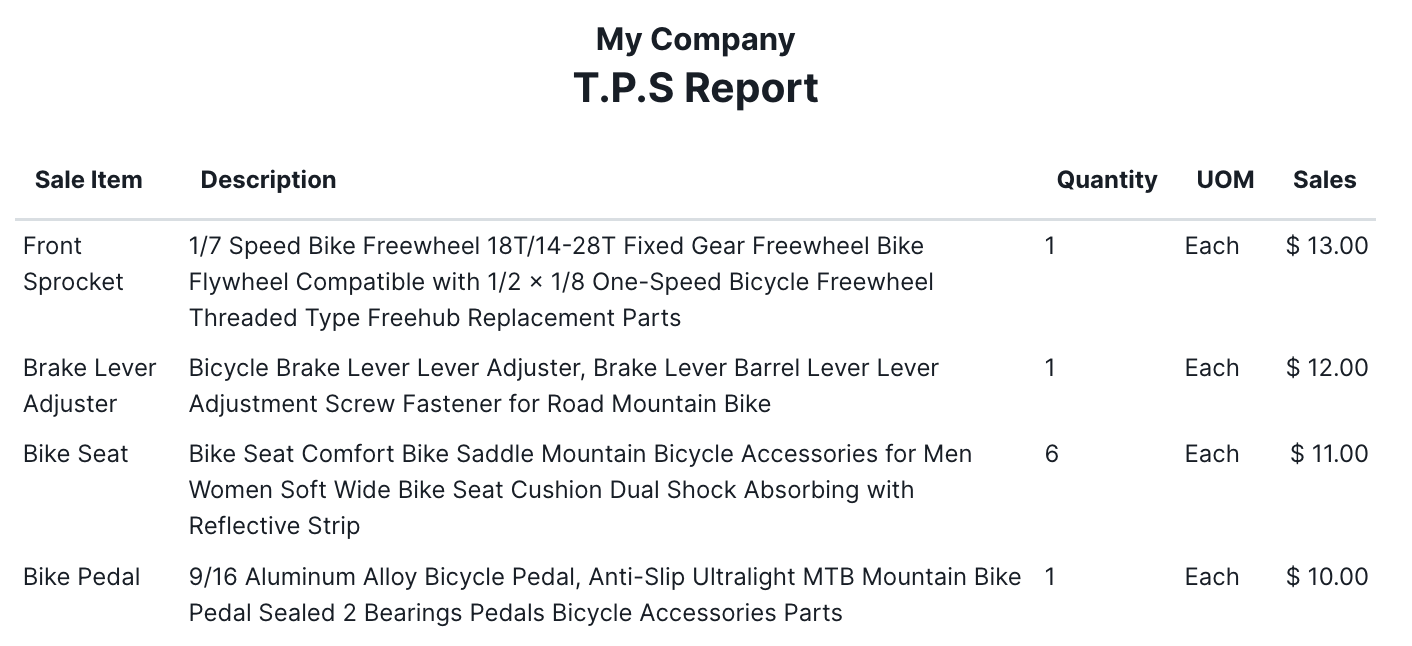
In addition to the Reports module, you can access this report in the Items module. Click on an item, and then click the  More button in the action bar. Click Show Report to bring up three options. Select Total Item Sales, and it will generate a report for all sales.
The Total Item Sales report includes the following column headers by default:
- Sale Item - The name of a sale item from the Items module.
- Description - An explanation of what the sale item is from the Items module.
- Sales - The gross dollar amount of sales for an item over a certain time period. If no Date Range is selected, this will be blank.
Optional
These are the Optional fields that you can use to modify the report:
- Date Range - A textbox that brings up a calendar to select a start and end date for the report. In addition, you can select one of these options on the right of the calendar:
- Today
- Yesterday
- This Week
- Last Week
- Last 7 Days
- This Month
- Last Month
- Include Cover Sheet - A checkbox that adds a cover sheet to the report that makes it look incredibly professional and confidential.
- Show UOM - A checkbox that adds a UOM column header in between the Description and Sales columns. It displays the unit of measure for each item in the report.
- Show Quantity - A checkbox that adds a Quantity column header in between the Description and UOM columns. It displays the number of units of each item that have been sold.
To select all of the status fields at once, click the Select All Optional checkbox. The Select All Optional checkbox won’t affect the Date Range. That will have to be updated manually.
To apply your changes and see what they look like in the report, click the GENERATE REPORT button on the bottom-right. And follow the directions at the top of the main Reports article to save your changes to a Preset.