|
|
| Line 252: |
Line 252: |
| {{Report|Manufacture Order Stage|Shows the various stages for open work orders. Use % for a wildcard search}} | | {{Report|Manufacture Order Stage|Shows the various stages for open work orders. Use % for a wildcard search}} |
| {{Report|Manufacture Order Traveler|Basic Report for Manufacture Orders}} | | {{Report|Manufacture Order Traveler|Basic Report for Manufacture Orders}} |
| | {{Report|Production Demand|Shows current demand (allocated to an order) for finished goods in a given date range. It shows demand for each order and also includes a summary by Part Number helping you know exactly what needs to be produced in manufacturing}} |
| {{Report|Production Report|Shows the parts built in completed work orders}} | | {{Report|Production Report|Shows the parts built in completed work orders}} |
| |- | | |- |
| Line 294: |
Line 295: |
| {{Report|Receiving History|Prints a list of all receipts over a date range, filtered by location group, vendor, and/or part}} | | {{Report|Receiving History|Prints a list of all receipts over a date range, filtered by location group, vendor, and/or part}} |
| {{Report|Receiving List|A list of Parts to be Received}} | | {{Report|Receiving List|A list of Parts to be Received}} |
| | {{Report|Receiving Summary|Shows an overview of orders that are in receiving and their status. It can show which orders have items that have been received but not reconciled which can help accountants}} |
| {{Report|Reconcile Report|Shows the detail of PO exports to the accounting system}} | | {{Report|Reconcile Report|Shows the detail of PO exports to the accounting system}} |
| |- | | |- |
 The Reports module, located in the
 Reporting group, organizes over 150 reports. In addition to many included reports, Fishbowl also offers custom reports and reports from the Fishbowl Store.
Module buttons
 Upload allows a report file to be uploaded.
 Update allows an existing report to be re-uploaded.
 Save will save any changes made to the report.
 Delete will delete the report if it is not read-only.
 Duplicate creates a copy of the report that can be renamed and modified.
 Request opens a window to request a custom report from Fishbowl.
 Server Log opens a window with technical information about recent server activity. This information can then be sent to Fishbowl.
 Email opens a window to compose an email. If the module's default report is specified, the PDF report will be attached. Email can be configured on the Email tab of the
 Settings module.
 Print sends the default module report to the printer.
 How To opens this article in a web browser.
 Refresh reloads whatever is currently open in the module.
Module associations
When a report is associated with a module, the report will appear in the Reports menu when the module is open. Below are the steps to associate a report with a module.
- Open the report in the Reports module.
- Click the Details tab.
- Place a checkmark next to each module the report should be associated with.

- Click the Save button on the module toolbar.
The report will now appear in the Reports menu when the associated module is open. Selecting the report from the menu will open the report. Selecting Reports Module from the menu will open the Reports module.

Default module report
Each module also has a default report. The default report is printed when clicking the Print button or selecting Print/Print Preview from the File menu. Below are the steps to set a default report for a module.
- Open the Reports module.
- Click the Tools menu and then select Module Options.
- Click the
 Search button next to a module, and select the report to be used as the default report.

Default printer
If system printing is disabled, the default printer for each report can be set per location group. When a user prints a report, Fishbowl will look at that user's default location group and select the printer specified for that report and location group.
- To set a default printer, click the Modify Report button on the desired report.
- Click the Printer tab.
- Select the default printer from the dropdown for each location group.
- Click the
 Save Filters button.


In the scenario shown above, Fishbowl looks at that user's default location group and selects the printer specified for that report and location group.
For any print job, the user can change the selected printer before actually sending the print command.
System printing
System printing can be enabled by clicking the Tools menu, selecting Program Options, and then clicking the General tab.
If Use System Printing is selected, the operating system's default printer will be selected in the printer dialog instead of the default location group printer.


In the scenario shown above, a warning is displayed to let the user know that the Windows default printer will be selected.
For any print job, the user can change the selected printer before actually sending the print command.
Modify report filters
Reports in Fishbowl can be easily modified by using the report filters. Filters are options that control what the report displays such as date ranges, checkboxes, hide/show columns, etc.

Follow the steps below to modify report filters.
- Click the
 Modify Report button on a report to see the report filters dialog.
- Set the desired filters. Most reports have multiple tabs of filters.
- Click the Save Filters button to save the current parameters so that they will load each time the report is opened.
- To have multiple sets of report filters, first duplicate the report.
Saving report filters changes the default for all Fishbowl users. Users can customize their own filters by first adding the report to their favorites. Below is a description of the buttons found at the bottom of the Modify Report window.
- The Save Filters as Default Filters button saves the current filters so they will load each time the report is opened.
 The Load Default Filters button reloads the user saved filters.
 The Reset all Filters button temporarily resets all filters to the report's default filters. The filters will be set to how they were when Fishbowl was installed, before the user saved any filters. Next time the report loads, it will revert to the user saved filters.
 The Delete Saved Filters button deletes the user saved filters so that the report's default filters will load each time the report is opened.
Duplicate a report
Reports can be duplicated, placed in new folders, and renamed. There are several ways to make a duplicate copy of a report.
- Open a report and click the Duplicate button in the module toolbar at the top of the module.
- Right-click the report and click Add To Favorites. A copy of the folder will now be in the Favorites folder.
- Right-click the report, select Copy, and then right-click and select Paste in the desired folder. Rename the report as desired.
A duplicated report can be modified independently of the original report.
Create a new folder
New folders can be created in the Reports module. Follow the steps below to create a new report folder.
- Right-click the parent folder the new folder should be placed in.
- Select New Folder from the context menu.

- Rename the folder as desired.
Default folders or reports cannot be deleted. However, user-created folders, as well as any duplicated reports or custom reports can be deleted by right-clicking the item and selecting Delete.
Custom reports
Training Videos for custom reports can be found here. If modifying the filters of an existing report is not sufficient, a custom report can be requested.
- To get a custom report quote, click the Request button, or email reports@fishbowlinventory.com.
- Describe the report that is needed.
- After the report is ready, it will appear on the Custom Reports tab, to the right of the Search tab.

- To download and install the report, double-click the report name.
- Choose a folder for the report, and then click Finish.
The custom report will now appear on the Search tab, with all of the other reports in the selected folder.
In addition, Fishbowl sells pre-built reports in the Fishbowl Store. It is also possible to create or modify reports using a program called iReport. Fishbowl does not offer support for using iReport, but does provide some initial setup help. Please see iReport and iReport FAQs for more information.
Upload a report
When a report is purchased from the Fishbowl Store, or created in iReport, the report files need to be uploaded to the Fishbowl Server. These steps are not required for custom reports from Fishbowl. Follow the steps below to upload a report to the Fishbowl Server.
- Click the Upload button in the Reports module. This will open the Upload a new report wizard.
- Click the Browse button and select the report to be uploaded.
- Click Next.
- Enter a name and description for the report.
- Specify the folder the report should be placed in. New folders can also be created.
NOTE: If a report requires subreports, the main report should be uploaded using the above instructions. The subreport files should be manually pasted into the Fishbowl\server\reports\Custom folder on the Fishbowl Server computer.

Update a report
Follow the steps below to update a report that has already been uploaded.
- Load the report.
- Click the Update button located at the top of the Reports module or right-click the report and select Update from the context menu.
- Click the Browse button and select the new report file.
- Click Next.
- If necessary, click Yes to overwrite the existing report file.
Server log
The Server Log button on the Reports module toolbar shows the recent activity of the server, including any errors. The buttons in the window allow the data to be refreshed, copied, or sent to Fishbowl.

The report queries are stored in a separate file and can be viewed on the Reports tab.
MODULE OPTIONS
Some aspects of the Reports module can be customized by opening the module, clicking the Tools menu, and then selecting Module Options.
Module Options Select Reports tab
- Each module has a default report. The default report is printed when clicking the Print button or selecting Print/Print Preview from the File menu. The default report for a module can be set by clicking the Search button next to a module.
Module Options Other tab
- Always show Customize Reports dialog
- Checking this box will bring up the Modify Report dialog before running any report.
- The number of digits to show after the decimal for prices.
- The number of digits to show after the decimal for totals and subtotals.
- The number of digits to show after the decimal for costs.
- The number of digits to show after the decimal for quantities.
- The default date format for reports.
NOTE: The formatting of numbers in reports (price, cost, quantity, and date) can be customized even more in the  Property module.
Included reports
Below is a list of the reports included with Fishbowl. In addition to many included reports, Fishbowl also offers custom reports and reports from the Fishbowl Store. Click the report title to see more details, or click an image to see a larger screenshot of the report.
| Accounting
Adjustment Report - Shows inventory adjustments sent to the accounting system.

COGS By Account Summary - Generates a summary of all COGS values, by account.

Default Account Mapping - Prints a list of Fishbowl accounts and the default account they tie to in the accounting system.

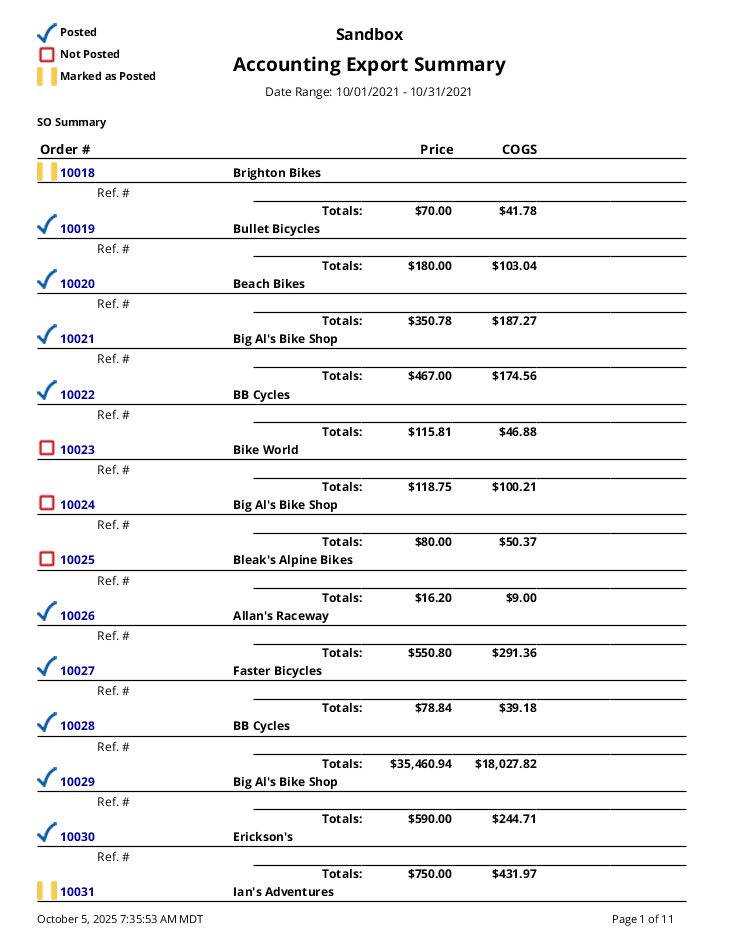
Export Summary - Prints a list of PO, SO, and WO transactions that have been exported (or are pending) to the accounting system. Work order amounts reflect the total adjustments made, not the final cost of the work order.
|
| Bill of Materials
Bill of Materials Report - Prints a bill of materials with its default options, stages, raw goods, and finished goods. The report calculates an estimated cost of finished goods based on the average cost of either the lowest-level raw material or top-level sub-assembly cost.

BOM Instructions - Prints a list of bills of material and notes for a part.

|
| Customer
Customer Address List - Prints a list of customer addresses.

Customer Details List - Prints a list of customer addresses and contact details.

Customer Price List - This may take a while to produce since it processes each product against all applicable pricing rules to determine a particular customer's price.

Customer Statement - Prints a statement for one or more customers, showing all unpaid sales orders, payments made, and balances remaining.

Dormant Customers - Prints a list of customers who have not purchased within the selected number of months.

|
| Gadgets
Gross Sales By Product Bar Graph - Prints a bar graph of gross sales for the date range specified, ordered from greatest to least. An empty date range will report on gross sales to date.
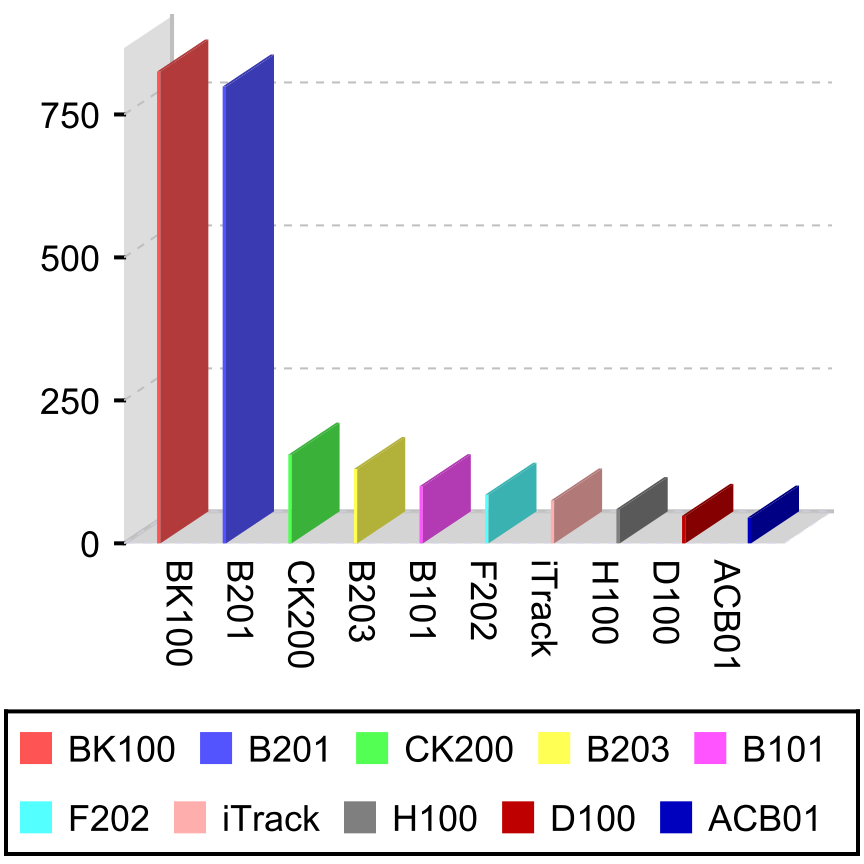
Gross Sales By Product Pie Chart - Prints a pie chart of gross sales for the date range specified, ordered from greatest to least. An empty date range will report on gross sales to date.

Gross Sales By Salesperson Bar Graph - Prints a bar graph of gross sales for the date range specified, ordered from greatest to least. An empty date range will report on gross sales to date.

Gross Sales By Salesperson Pie Chart - Prints a pie chart of each salesperson's gross sales for the date range specified, ordered from greatest to least. An empty date range will report on gross sales to date.

MTD Cumulative Sales - Prints a line graph of cumulative sales for the month to date.

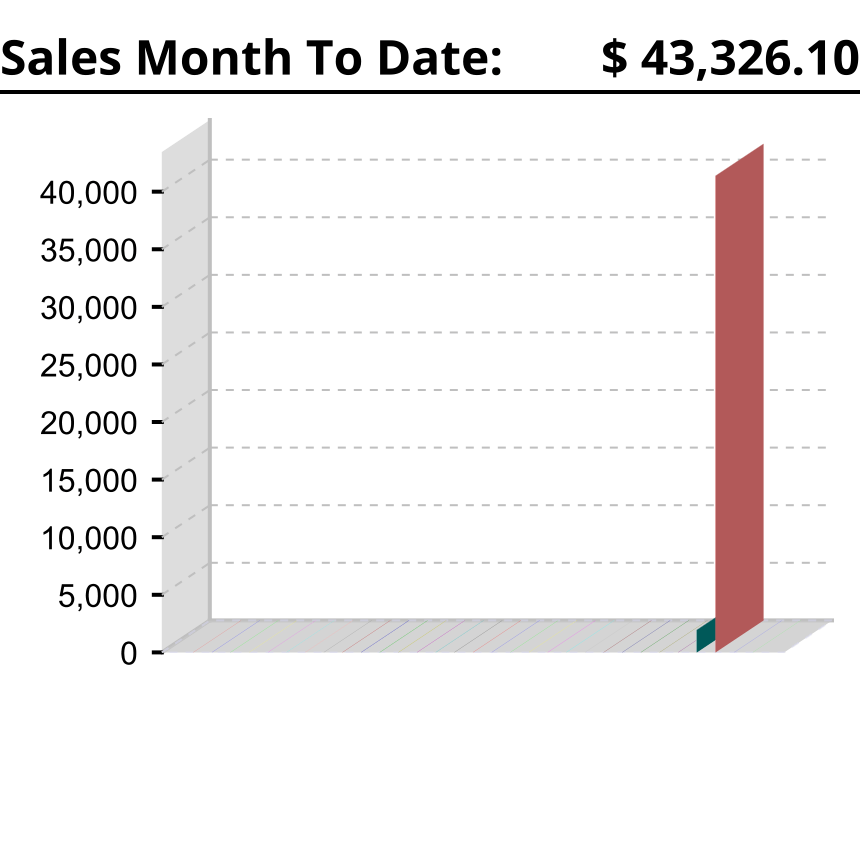
MTD Sales Bar Graph - Prints a bar graph of total sales for the month to date.
Turnover Bar Graph - Displays the number of times inventory is turned over, in a bar graph, during the given date range.
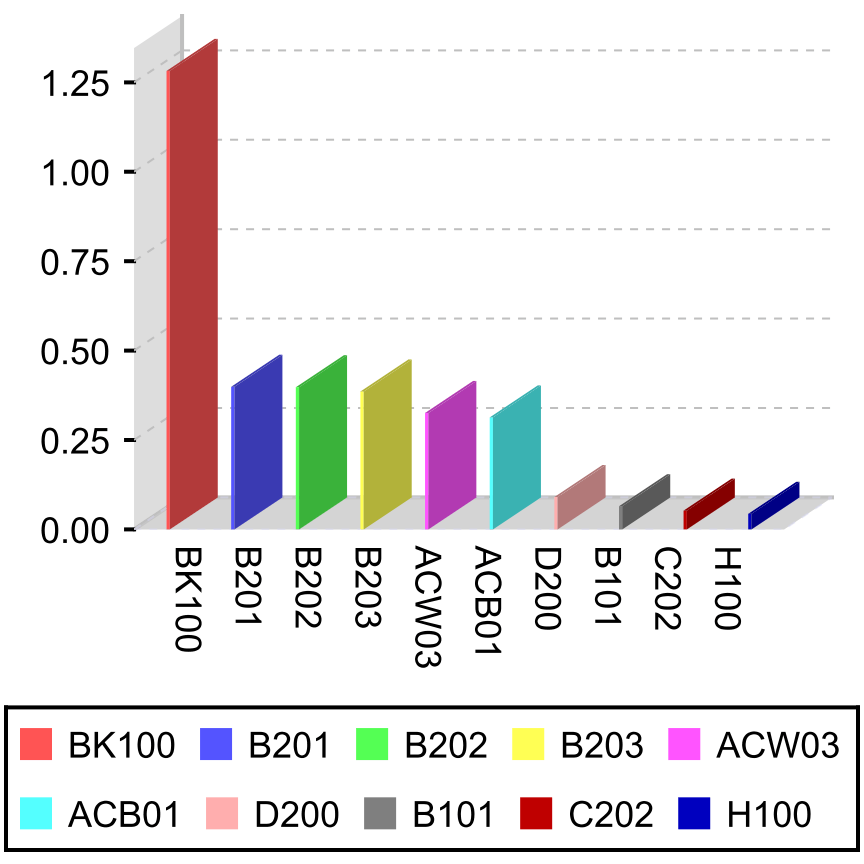
Turnover Pie Chart - Displays the number of times inventory is turned over, in a pie chart, during the given date range.
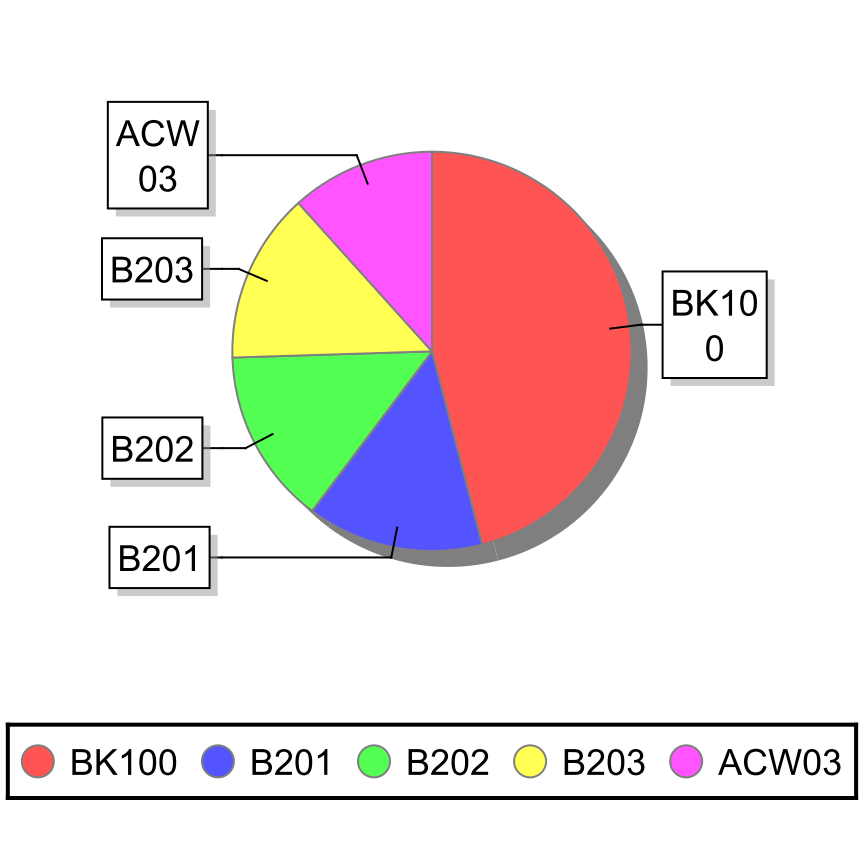
|
| Inventory
Aging Report - Displays the age of inventory.

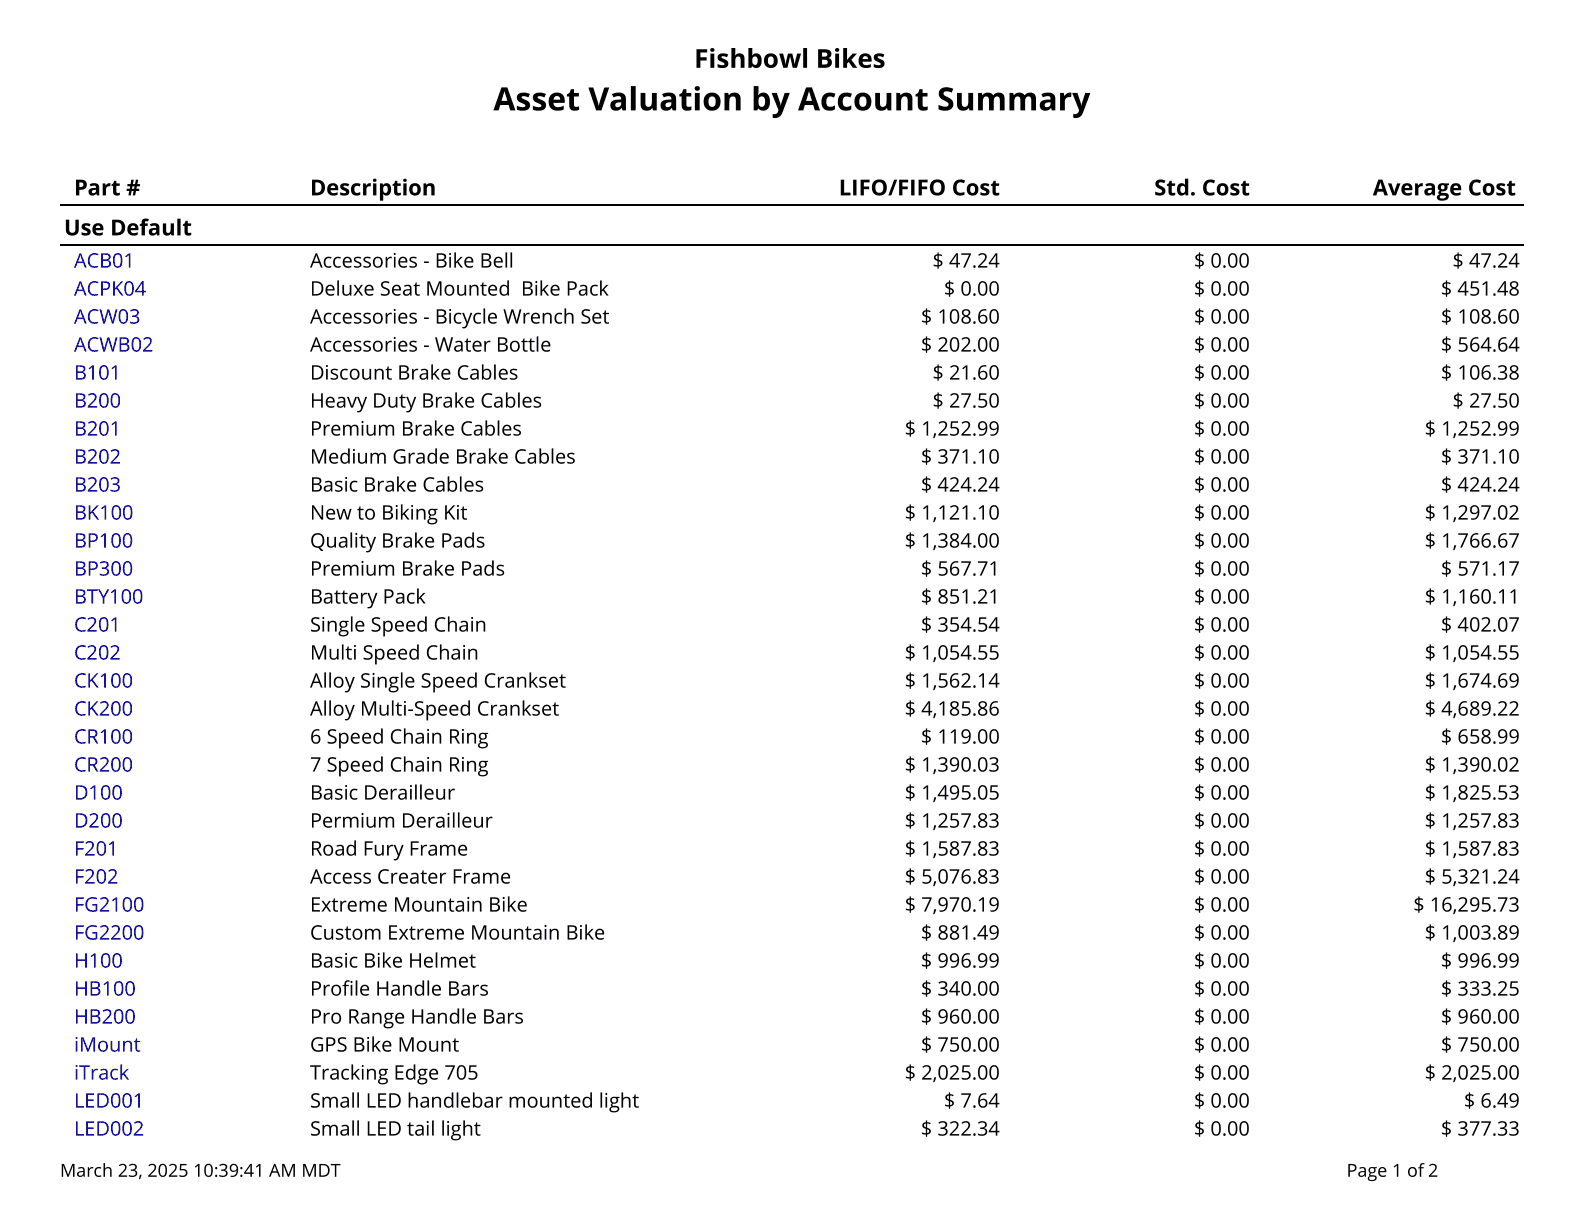
Asset Valuation By Account - Generates a summary of the quantity and total value of all parts currently on hand, broken down by Inventory Asset account.
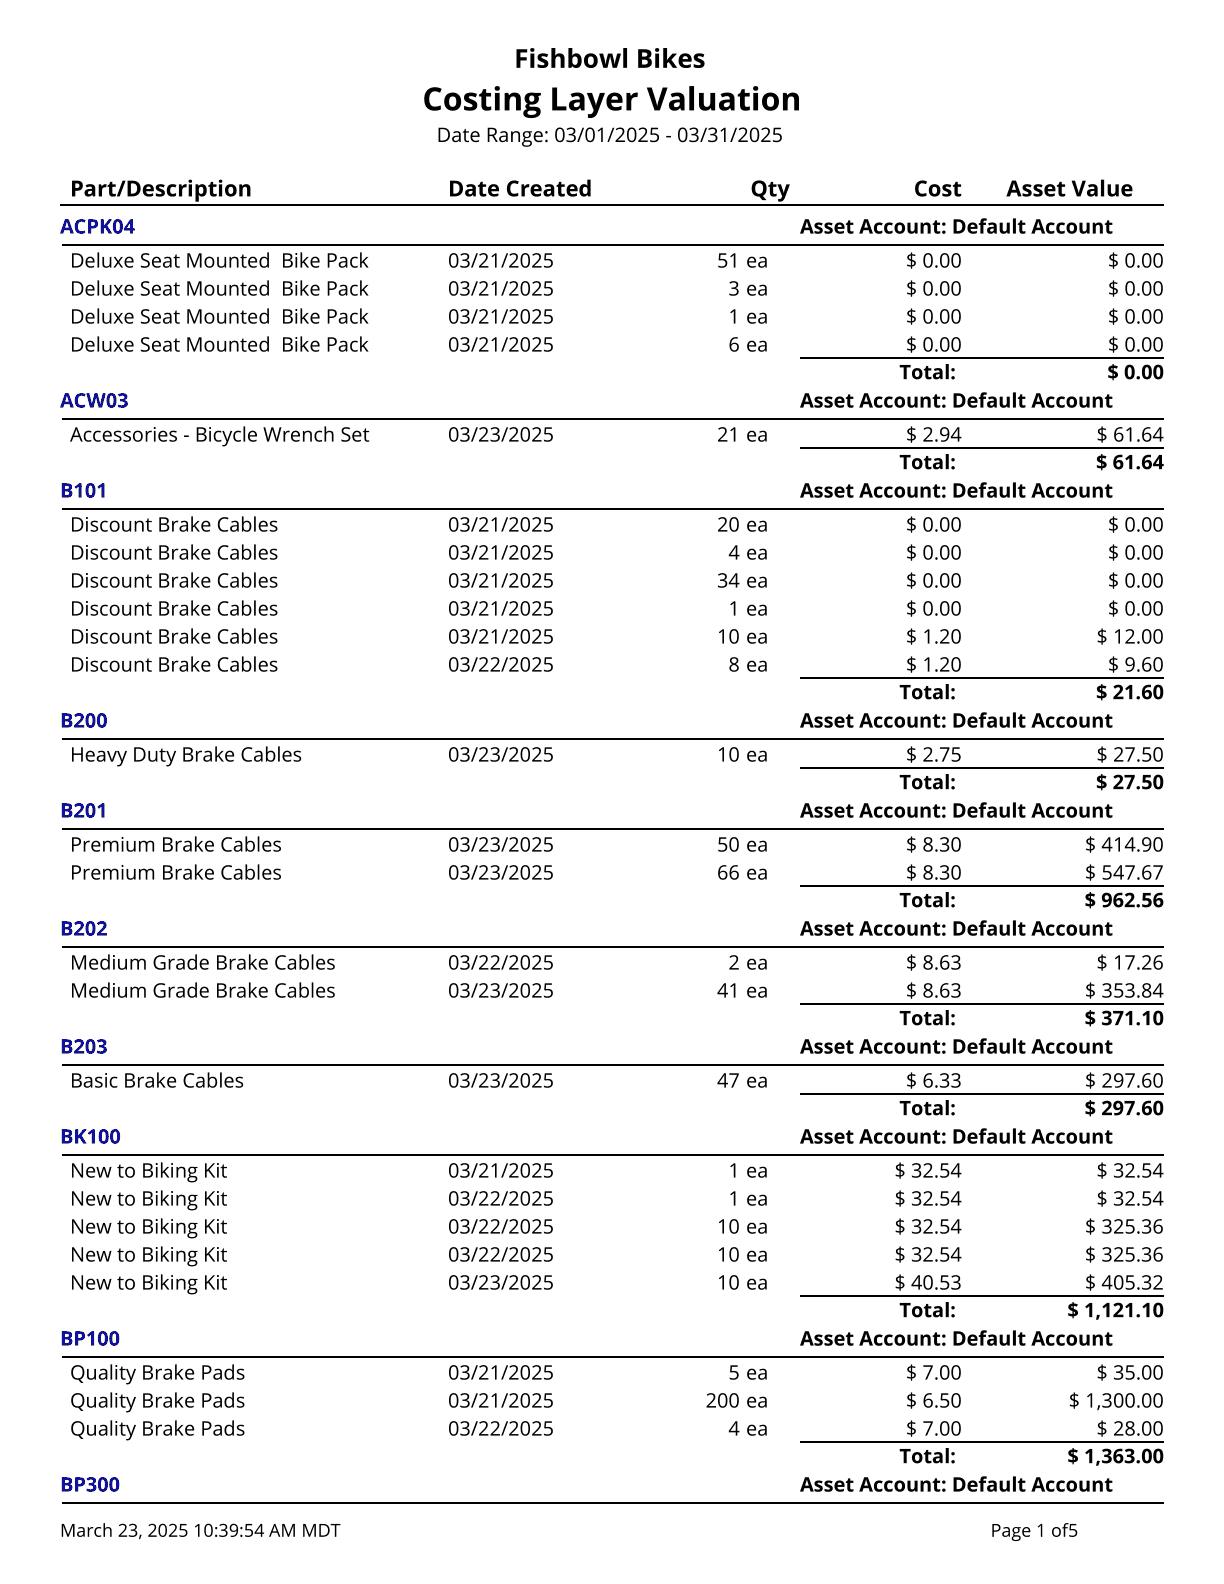
Costing Layer Valuation - Generates a summary of the quantity and value of all parts currently on hand. This is a LIFO/FIFO based report.
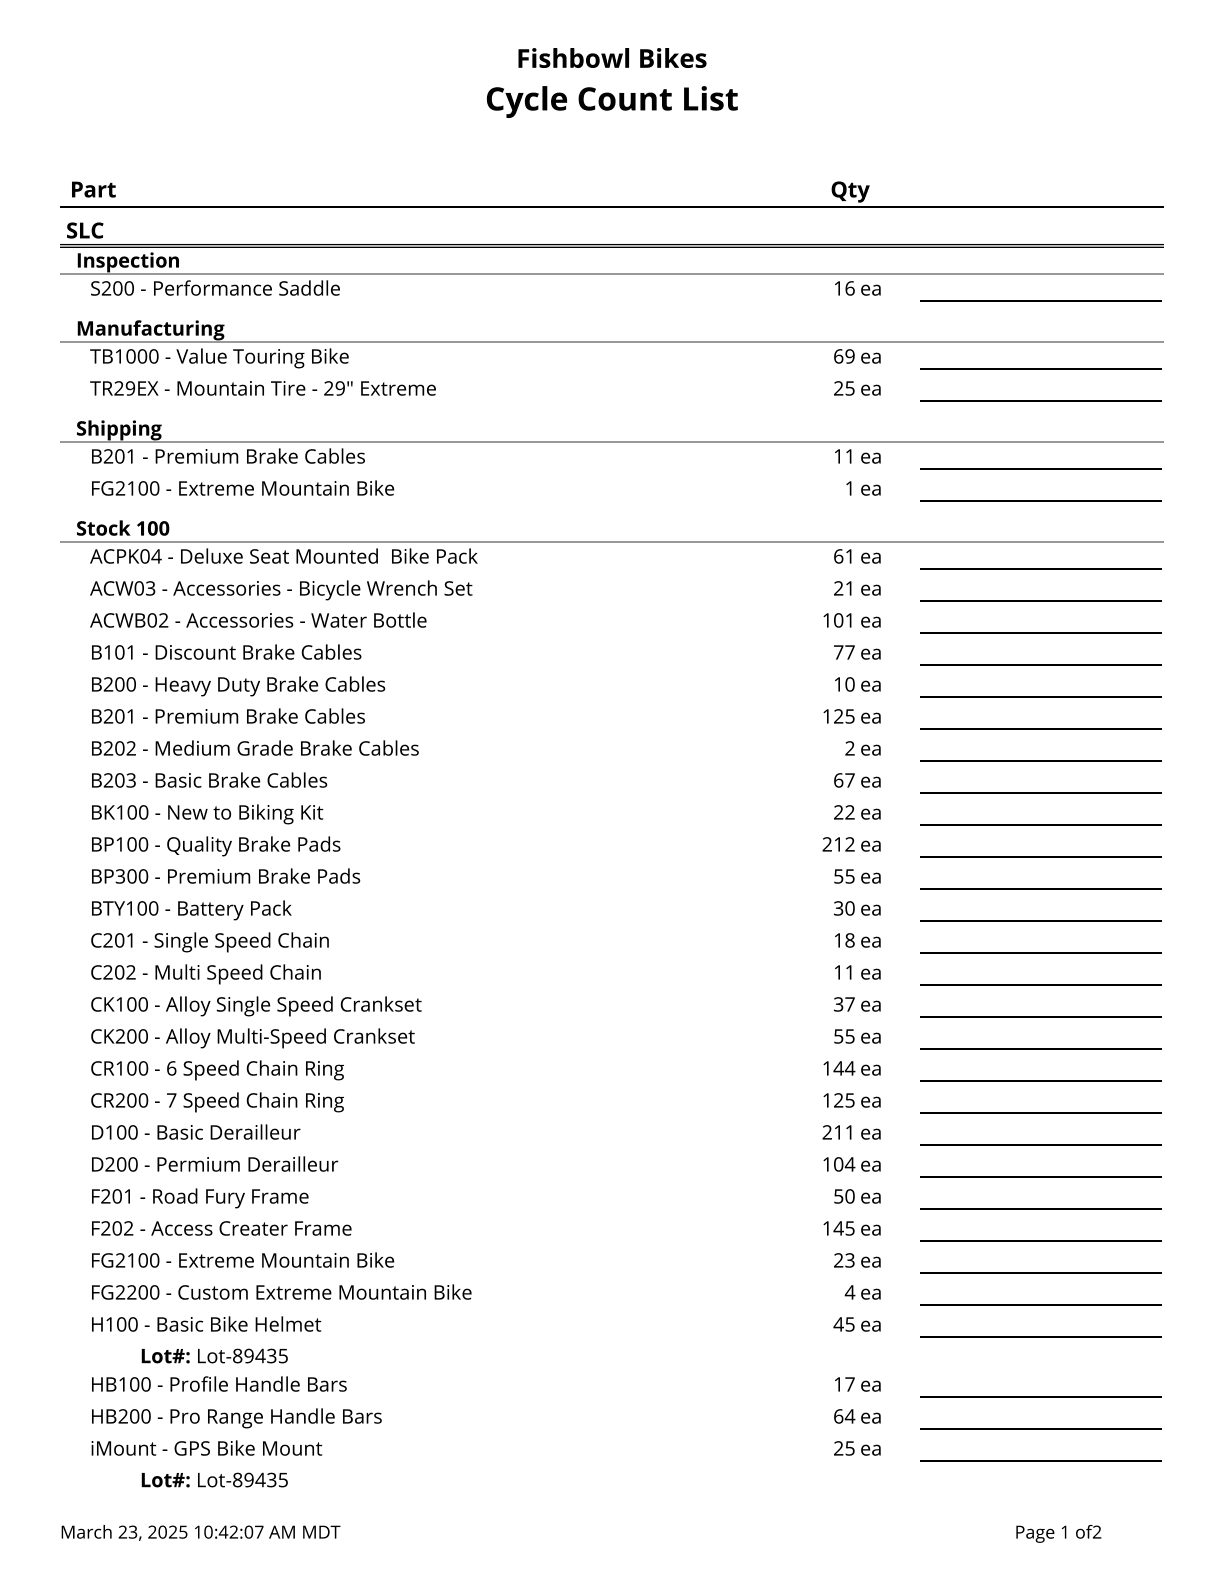
Cycle Count List - Prints a list of all parts and current quantities organized by location group and location. There is a blank line where you can write in the actual quantities as you make a physical count of your inventory. This is also known as a Physical Inventory Worksheet.
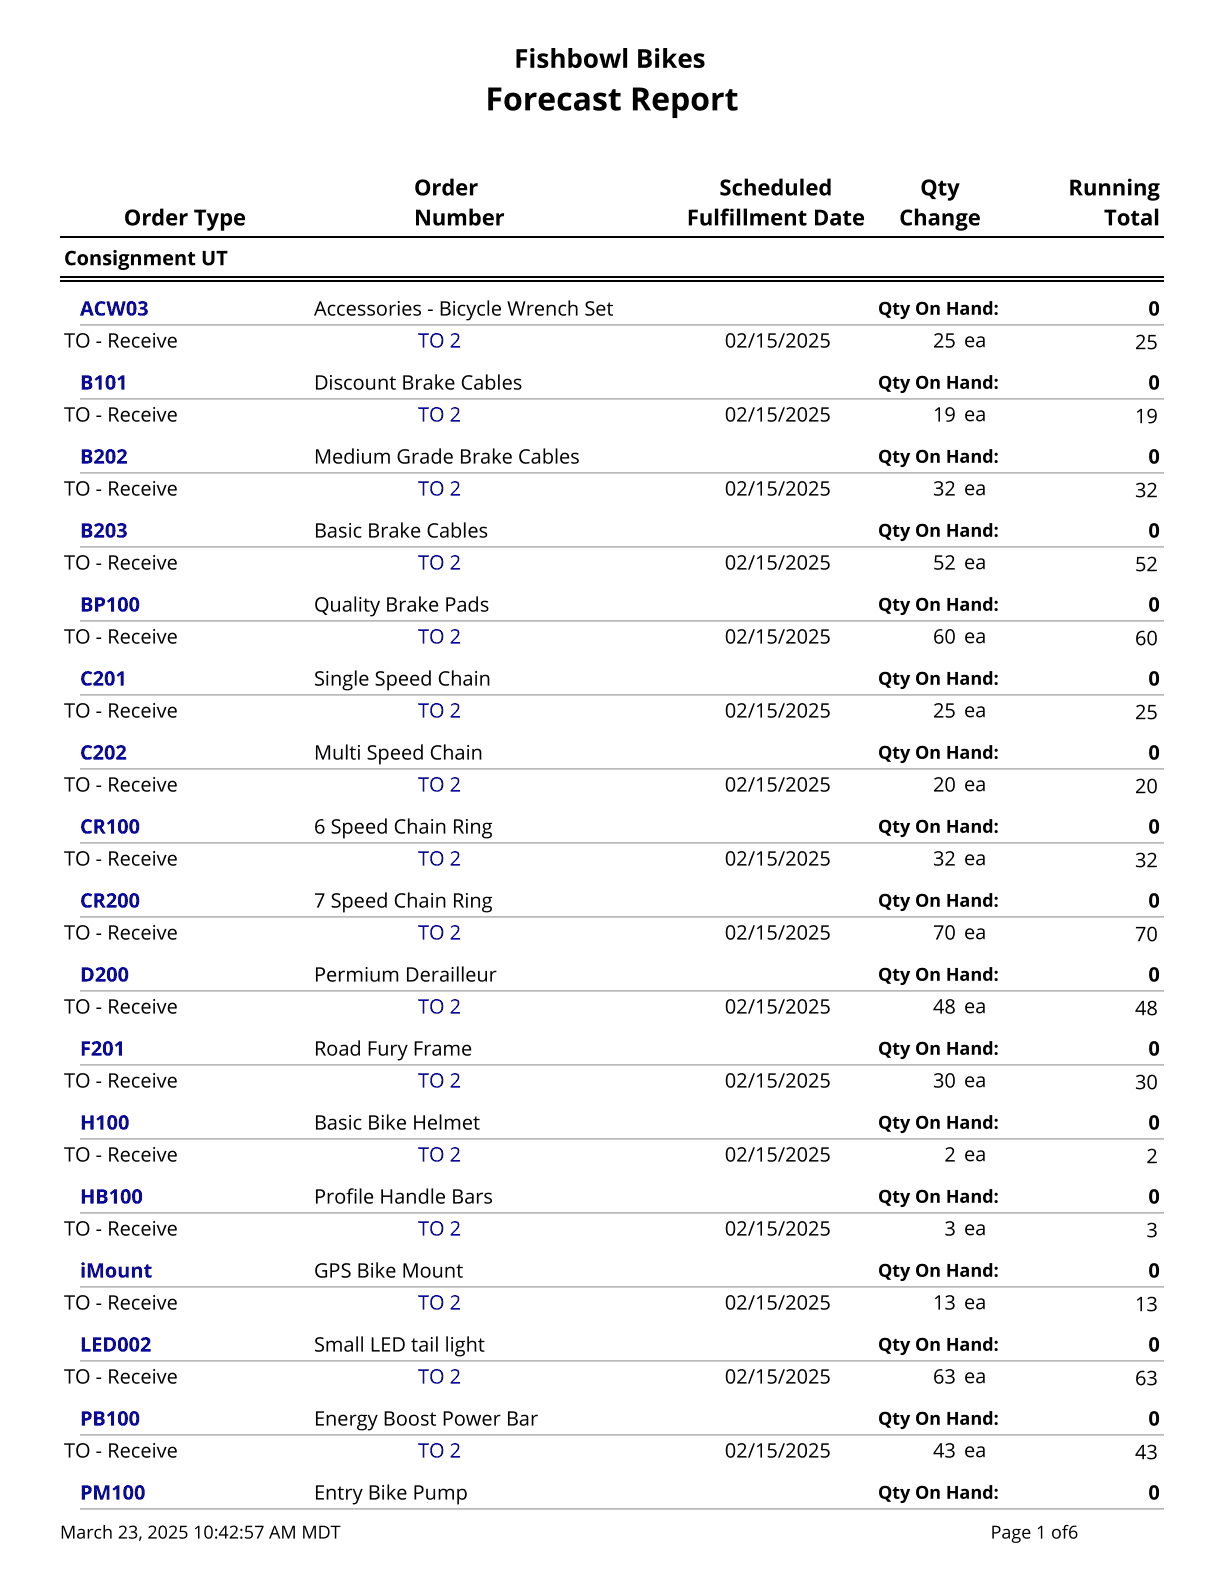
Forecast Report - Calculates a running total of allocated parts based on issued Sales Orders, Transfer Orders, Work Orders, and Purchase Orders.
Historical Part Cost Report - Displays the historical cost of parts on a specific day. Shows the quantity, unit cost, and total cost, with an option to select which costing method is displayed.

Inventory Availability - This is a consolidated report of the Inventory module. The Count parameter specifies the number of records to return. The Skip parameter skips that many records before starting the count.

Inventory Availability By LG - This is a consolidated report of the Inventory module. The Count parameter specifies the number of records to return. The Skip parameter skips that many records before starting the count.

Inventory Valuation Summary - Generates a summary of the quantity and value of all parts currently on hand. Cost values are based on today's costs.

Inventory Variance - Shows the shipping and receiving history for a part or all parts.

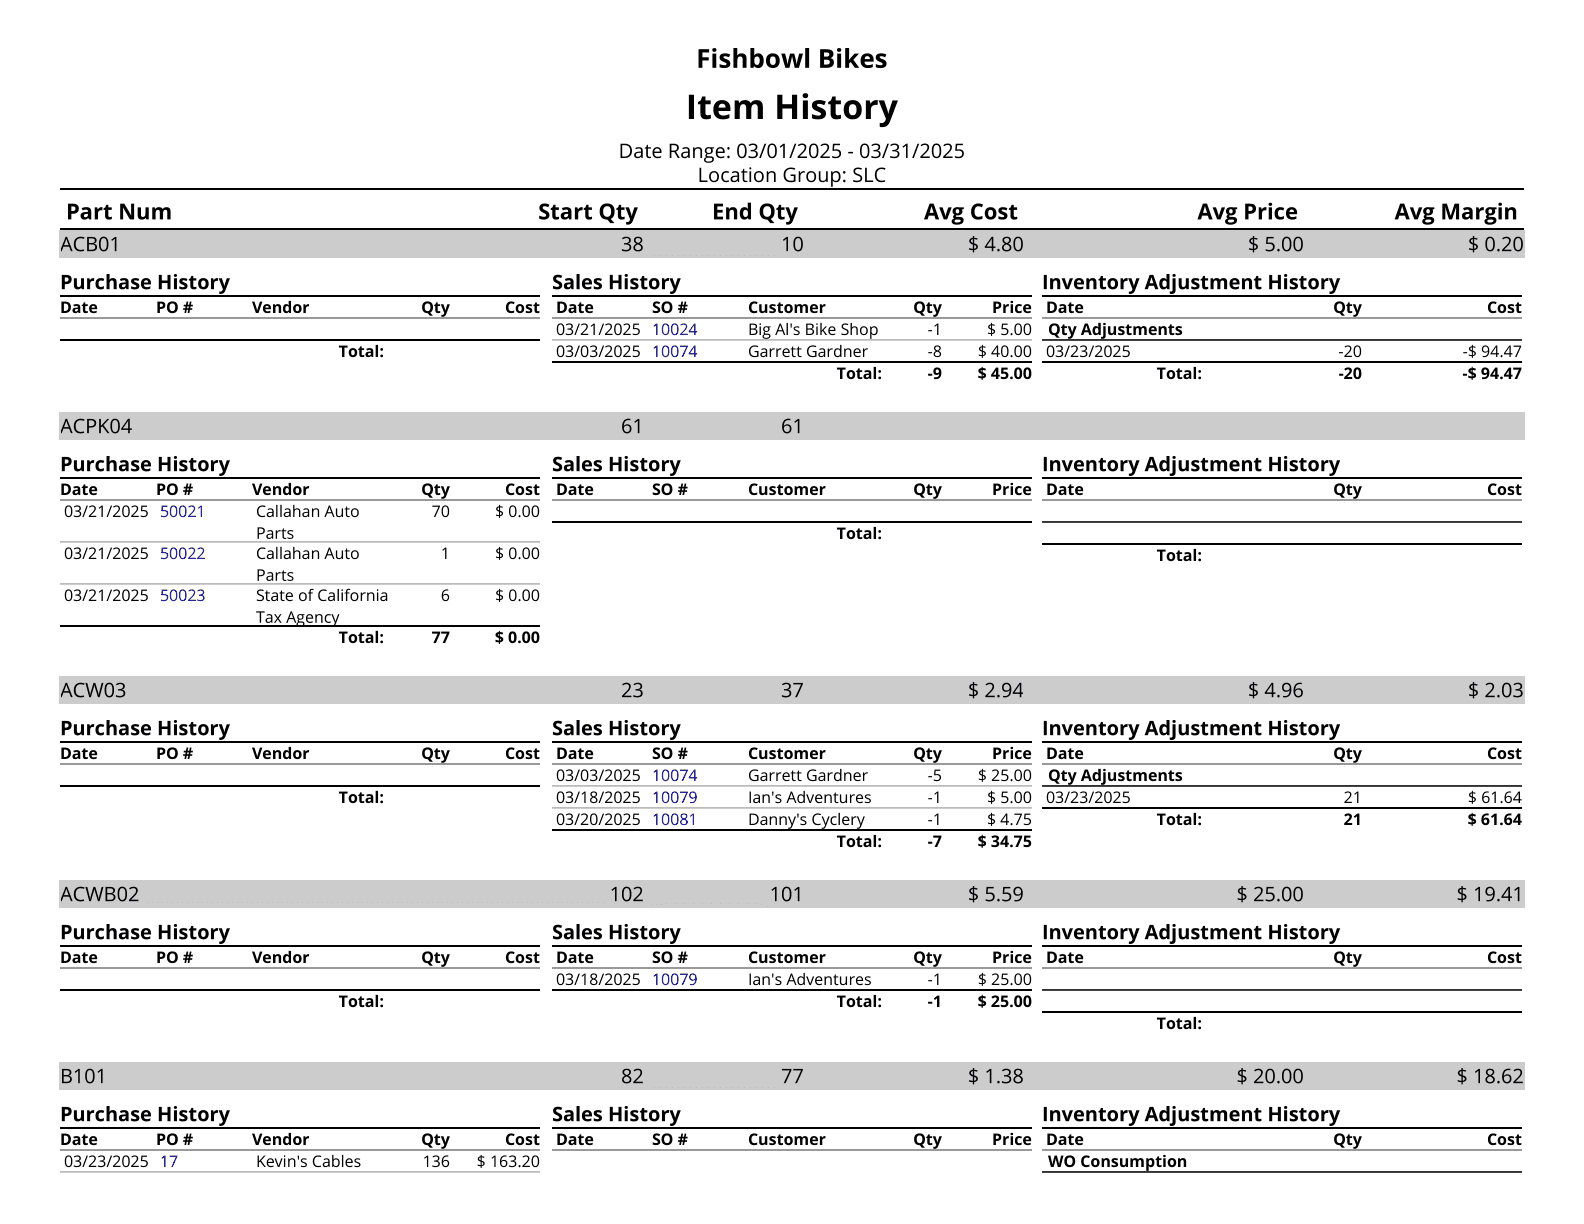
Item History - Displays information about an item, and historical activity within a location group.
Lot History - Shows the history for the specified lot number.

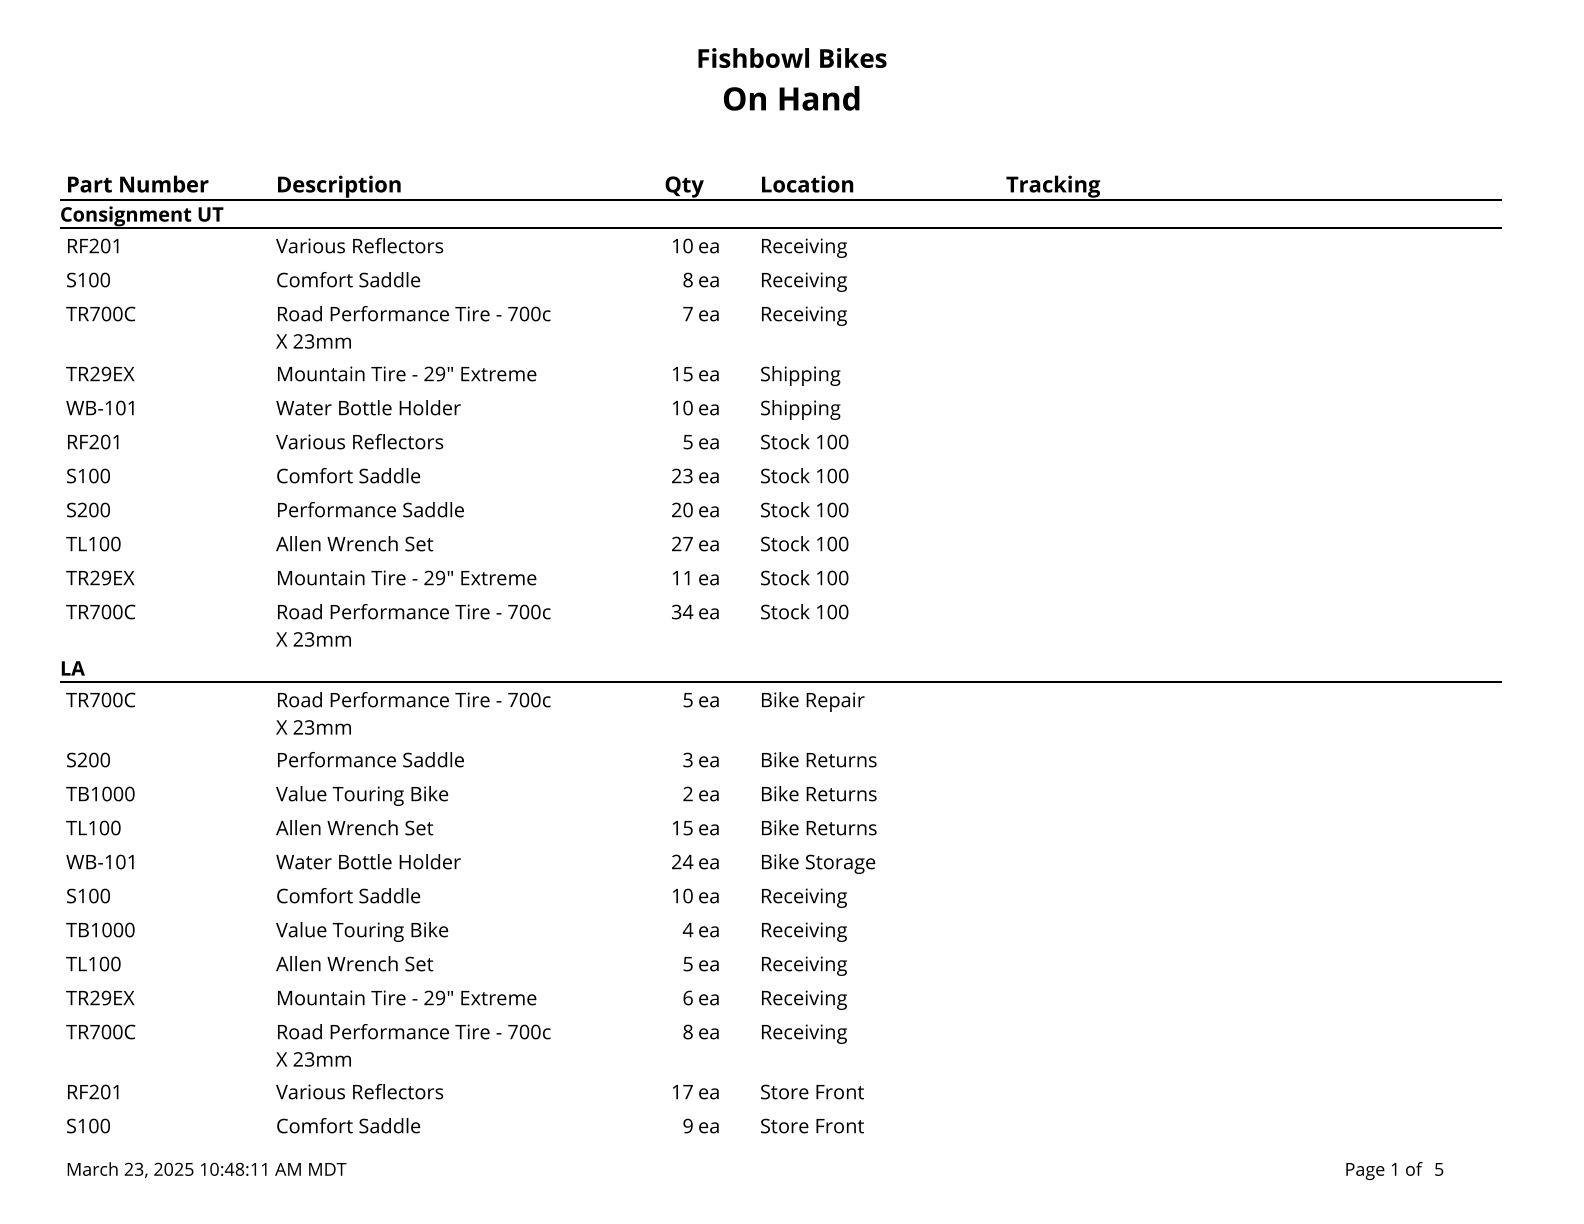
On Hand - Displays a list of parts with the current quantity on hand. *Does not filter for serial numbers.
On Hand By Date - Lists inventory quantities on hand at the end of a given day. Optional estimated total values may be included. Note: Deleted and renamed parts, as well as parts that had not been stocked before the report date, will not be reported. Cost values are based on today's cost.

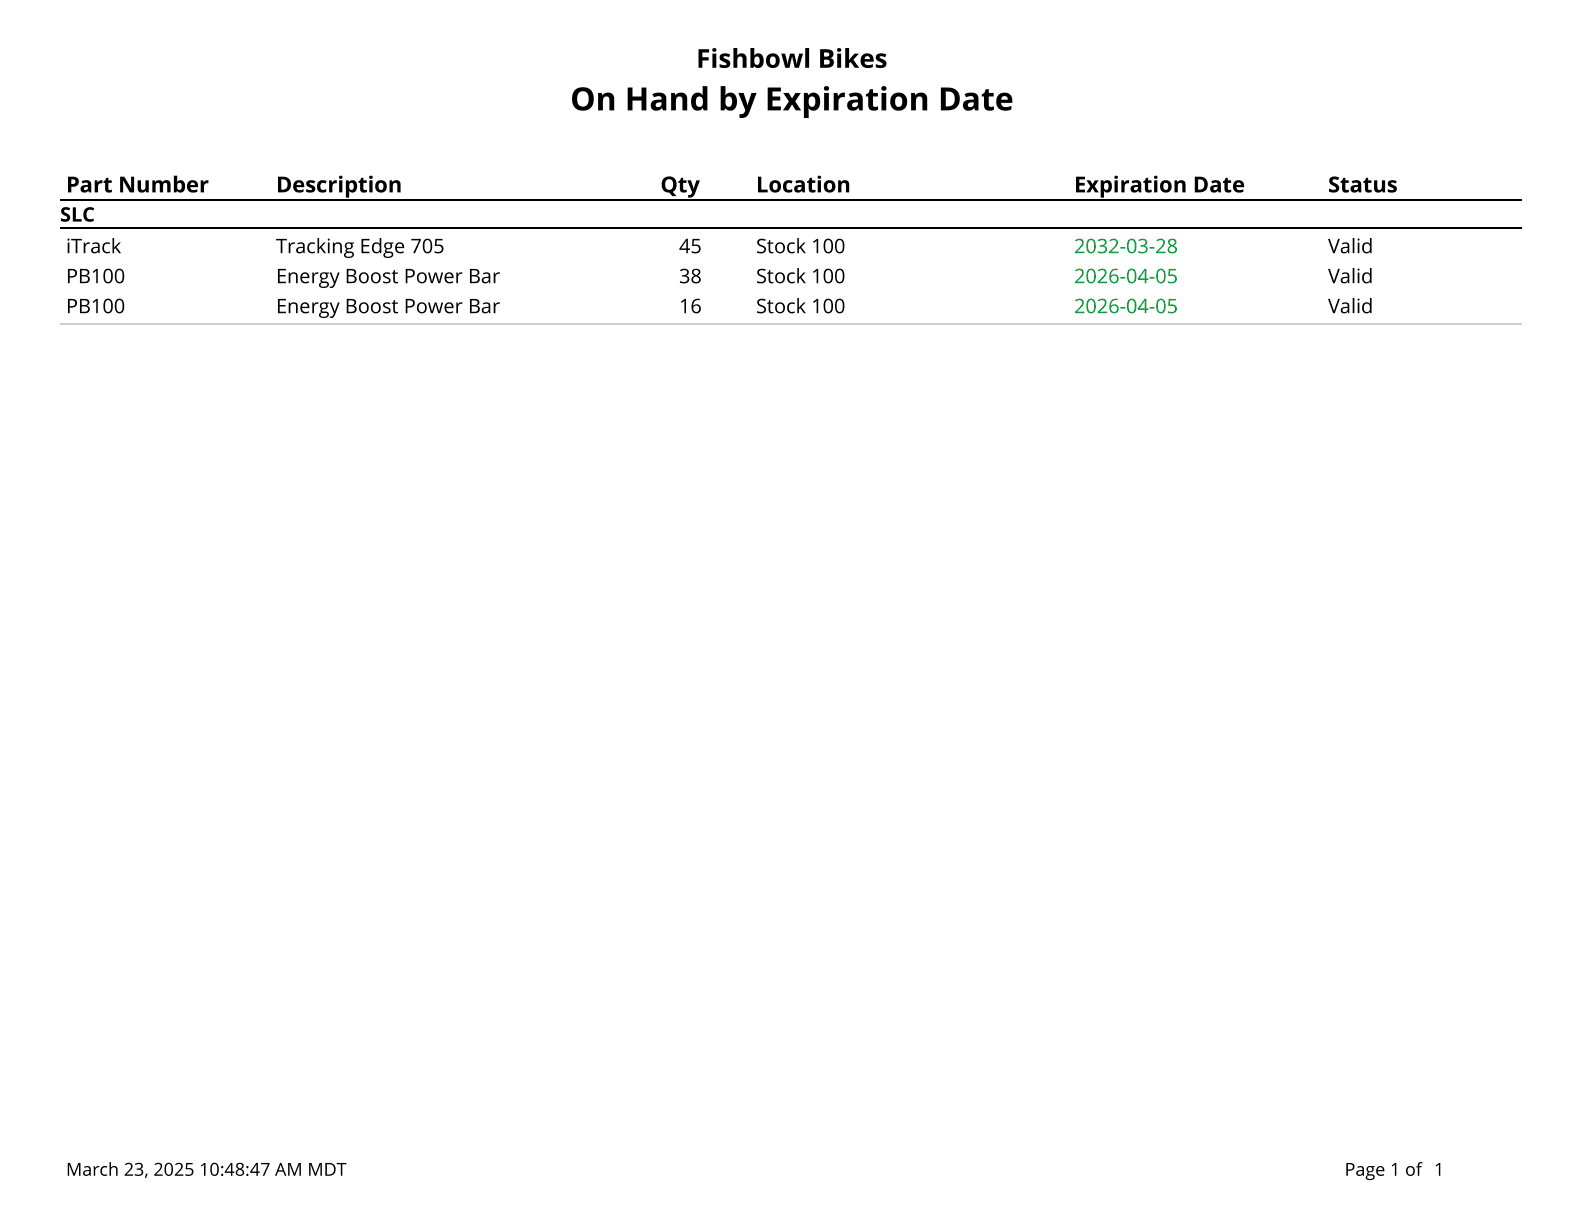
On Hand By Expiration Date - Displays expired and expiring inventory.
On Hand By Product Tree - On Hand report organized by Product Tree.

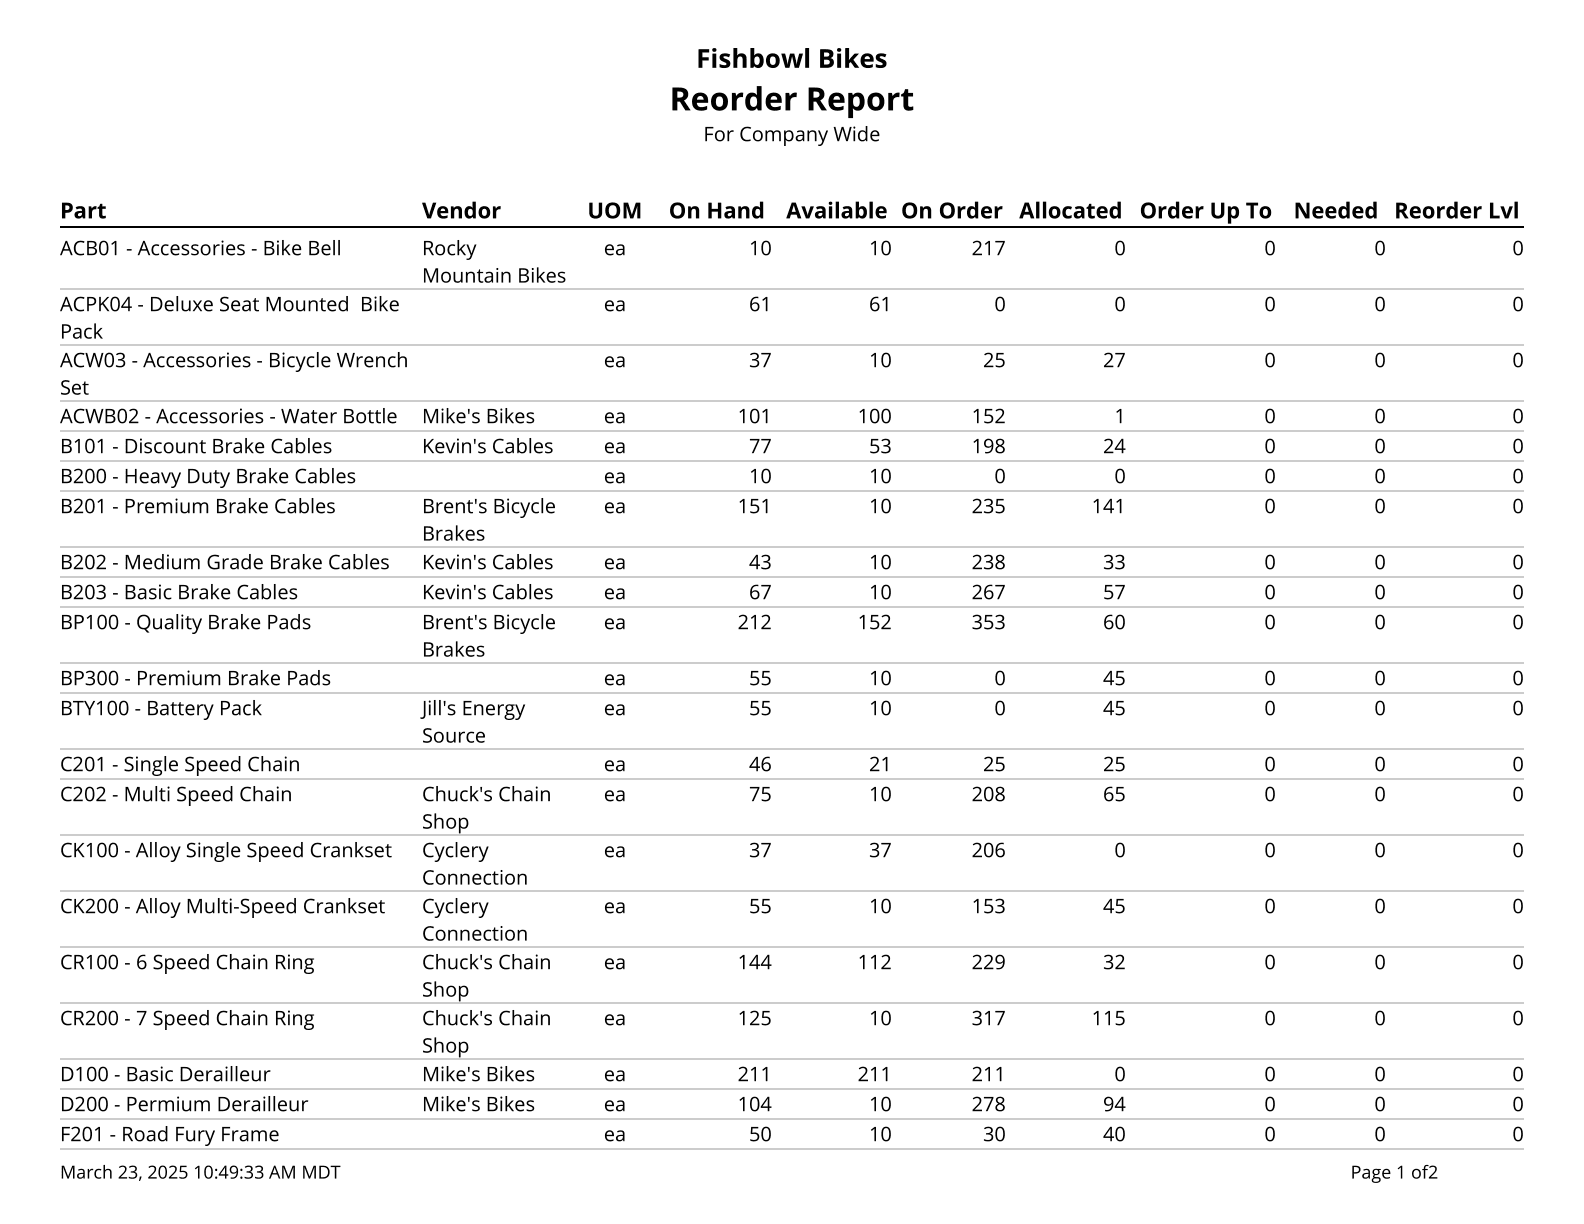
Reorder Report - Prints a list of parts below reorder tolerance.
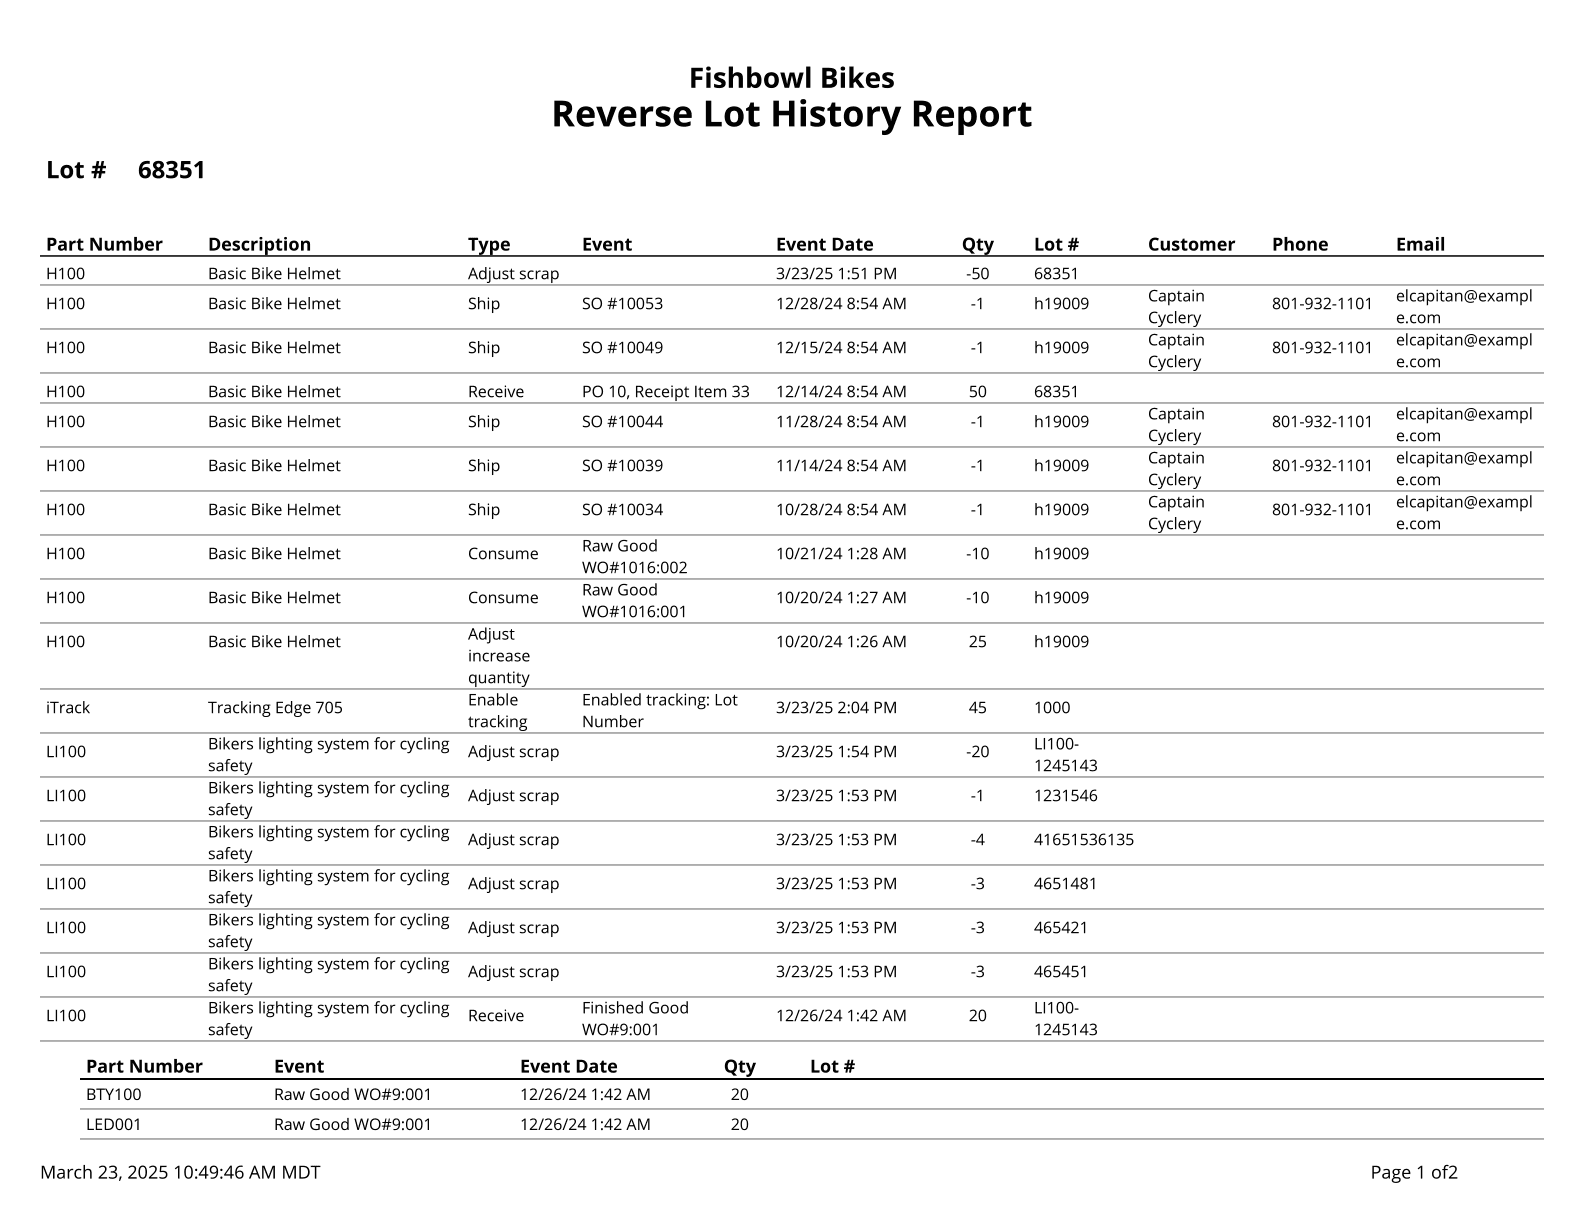
Reverse Lot History - Traces the history of a lot number from the present time to when it entered the system.
Turnover Report - Displays the number of times inventory is turned over during the given date range.

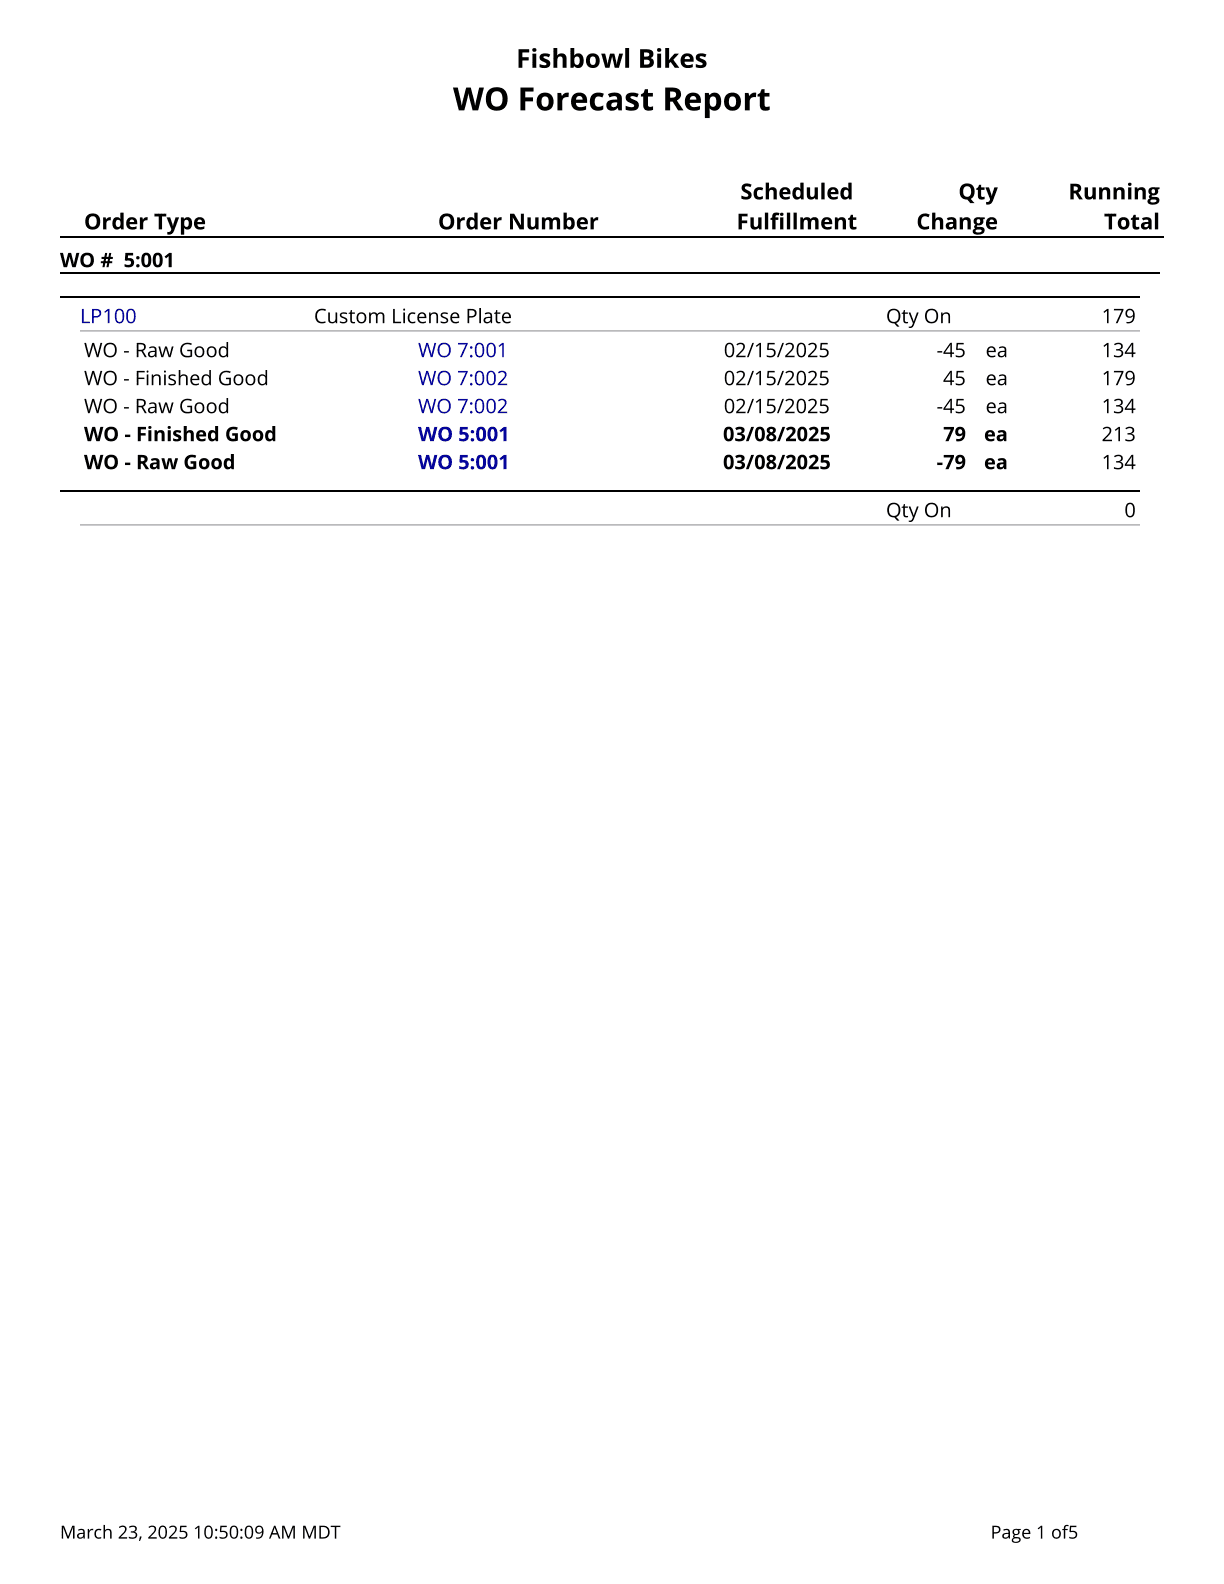
Work Order Forecast Report - Calculates a running total of allocated parts on orders separated out by work orders.
|
| Labels
2x4 Location Barcode Avery - Location barcodes (Code 128) for 2x4 Avery 8163 Labels.

2x4 Location Barcode One Off - Location barcodes (Code 128) for 2x4 One Off Labels.

2x4 Part Barcodes Avery - Part barcodes (Code 128) for 2x4 Avery 8163 Labels.

2x4 Part Barcodes One Off - Part barcodes (Code 128) for 2x4 One Off Labels.

2x4 Product Barcodes Avery - Product barcodes (Code 128) for 2x4 Avery 8163 Labels.
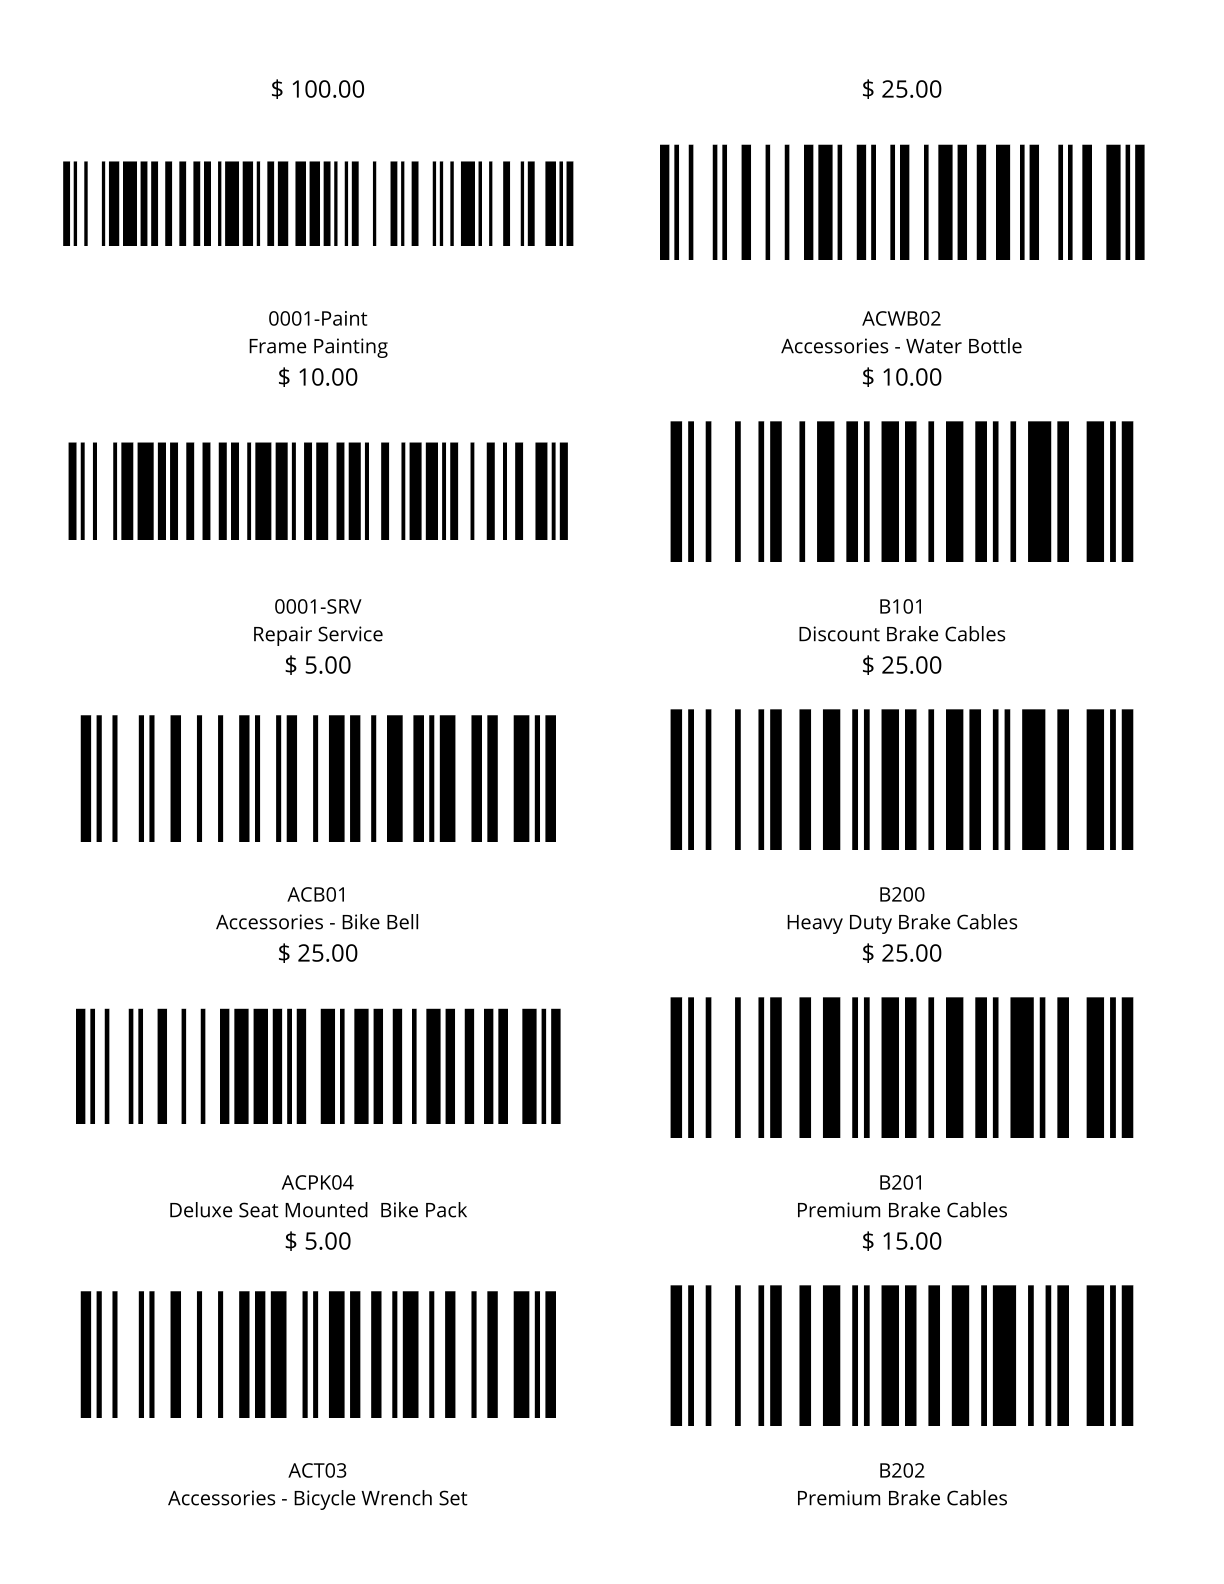
2x4 Product Barcodes One Off - Product barcodes (Code 128) for 2x4 One Off Labels.

4x6 Location Barcode One Off - Location barcodes (Code 128) for 4x6 One Off Labels.
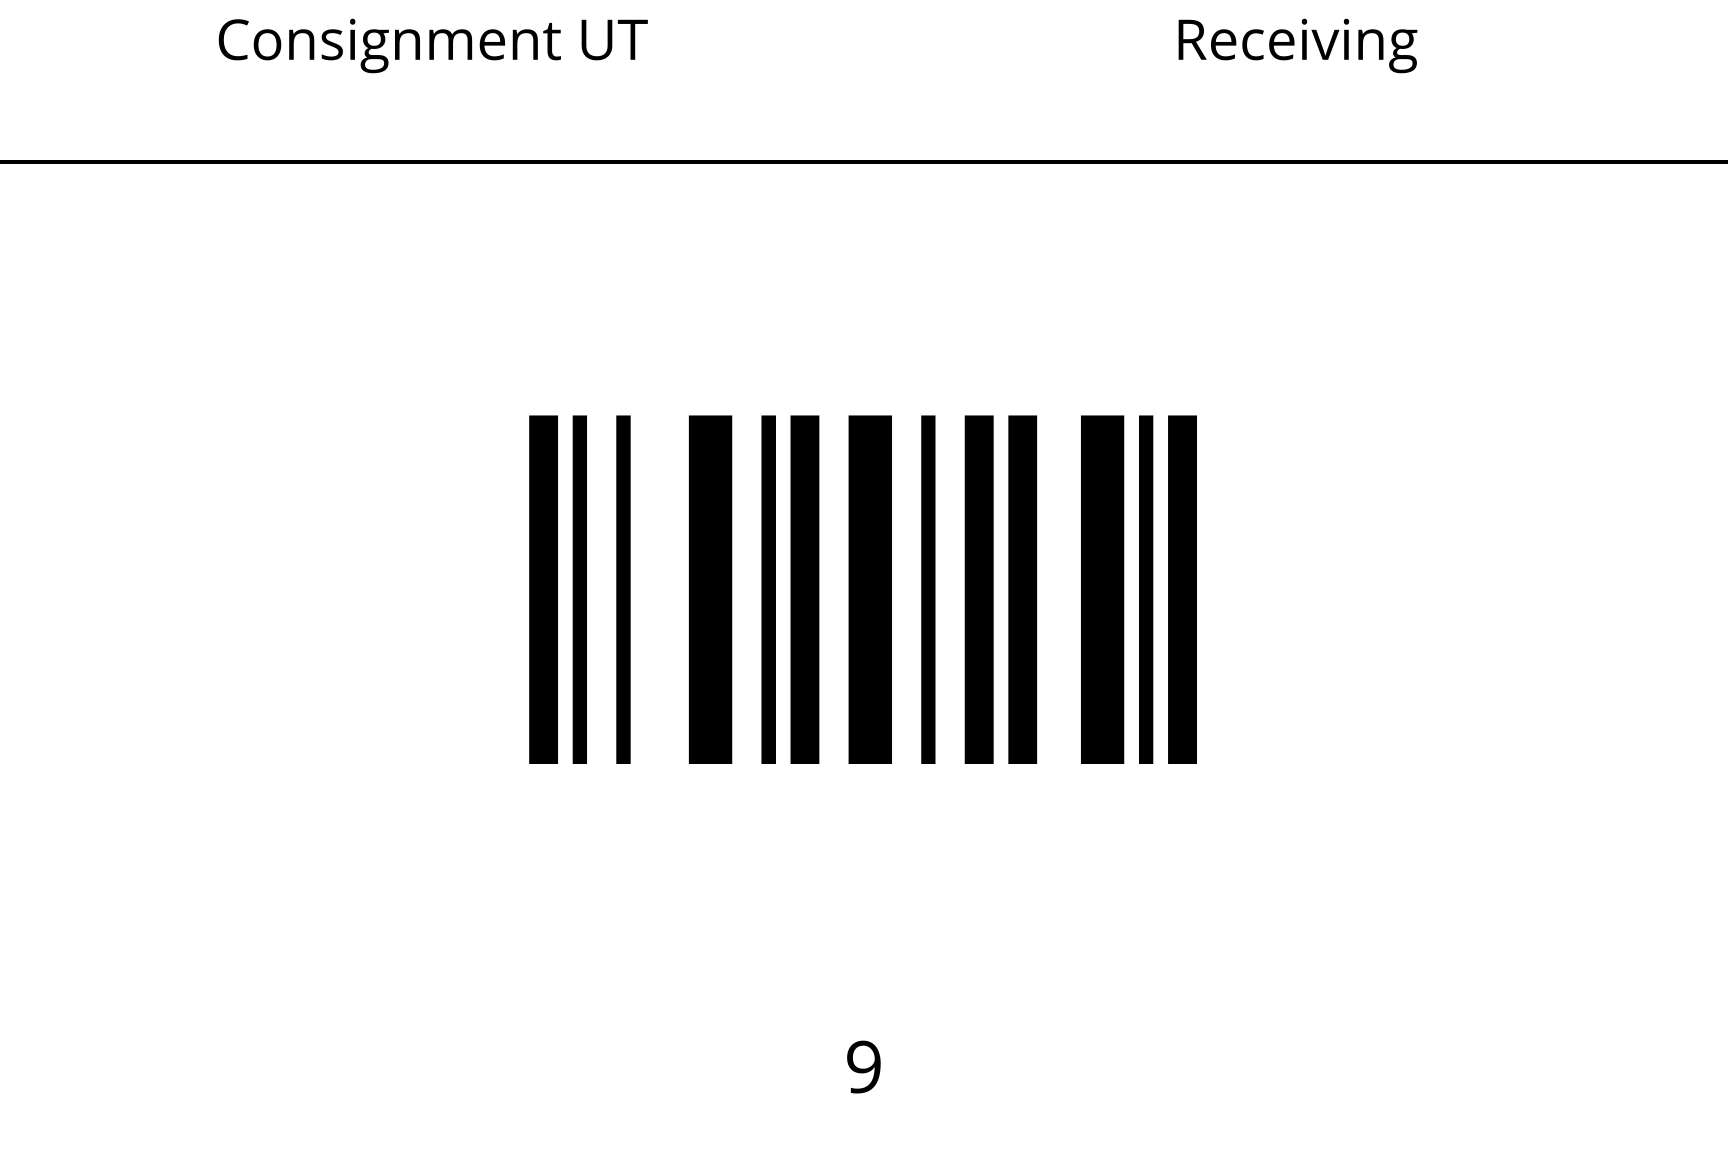
4x6 Part Barcodes One Off - Part barcodes (Code 128) for 4x6 One Off Labels.

4x6 Product Barcodes One Off - Product barcodes (Code 128) for 4x6 One Off Labels.
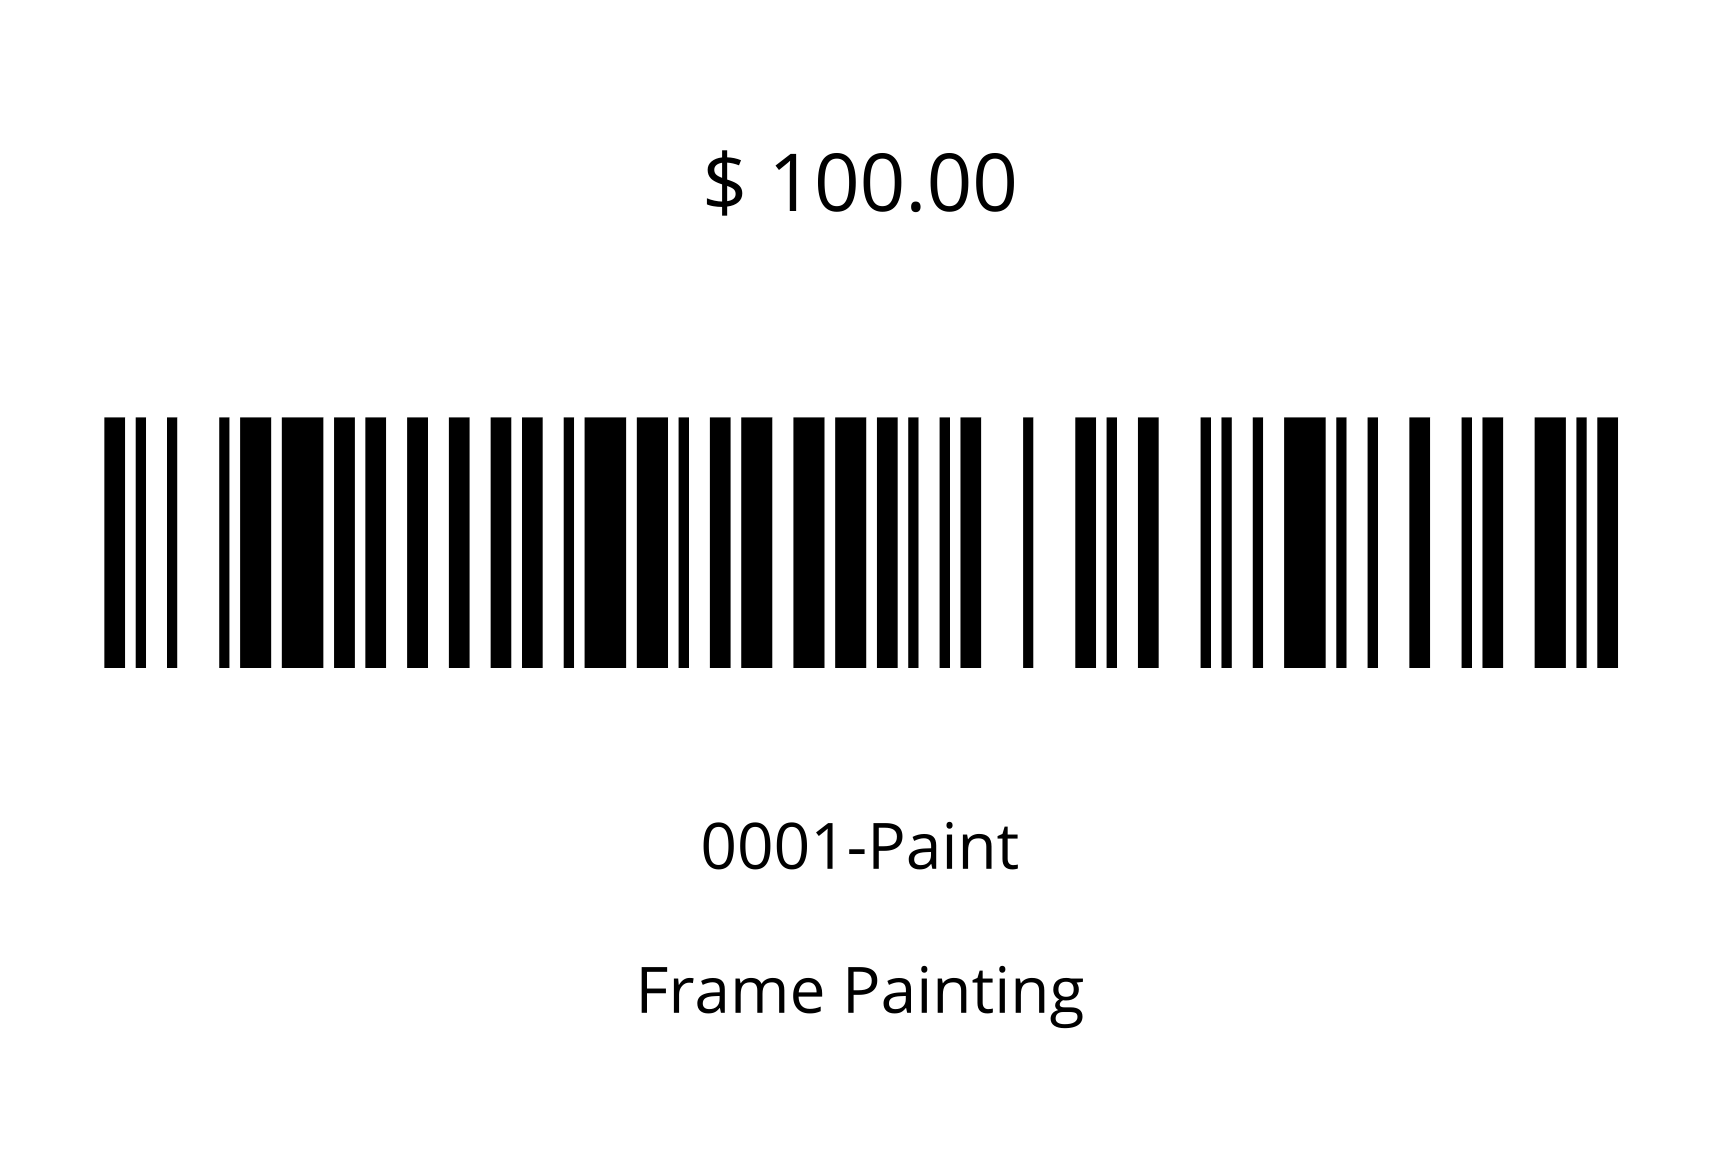
Customer Address Labels - Customer Address Labels for Avery Labels.

Location Barcode - Location barcodes (Code 128) for Avery 8160 Labels.
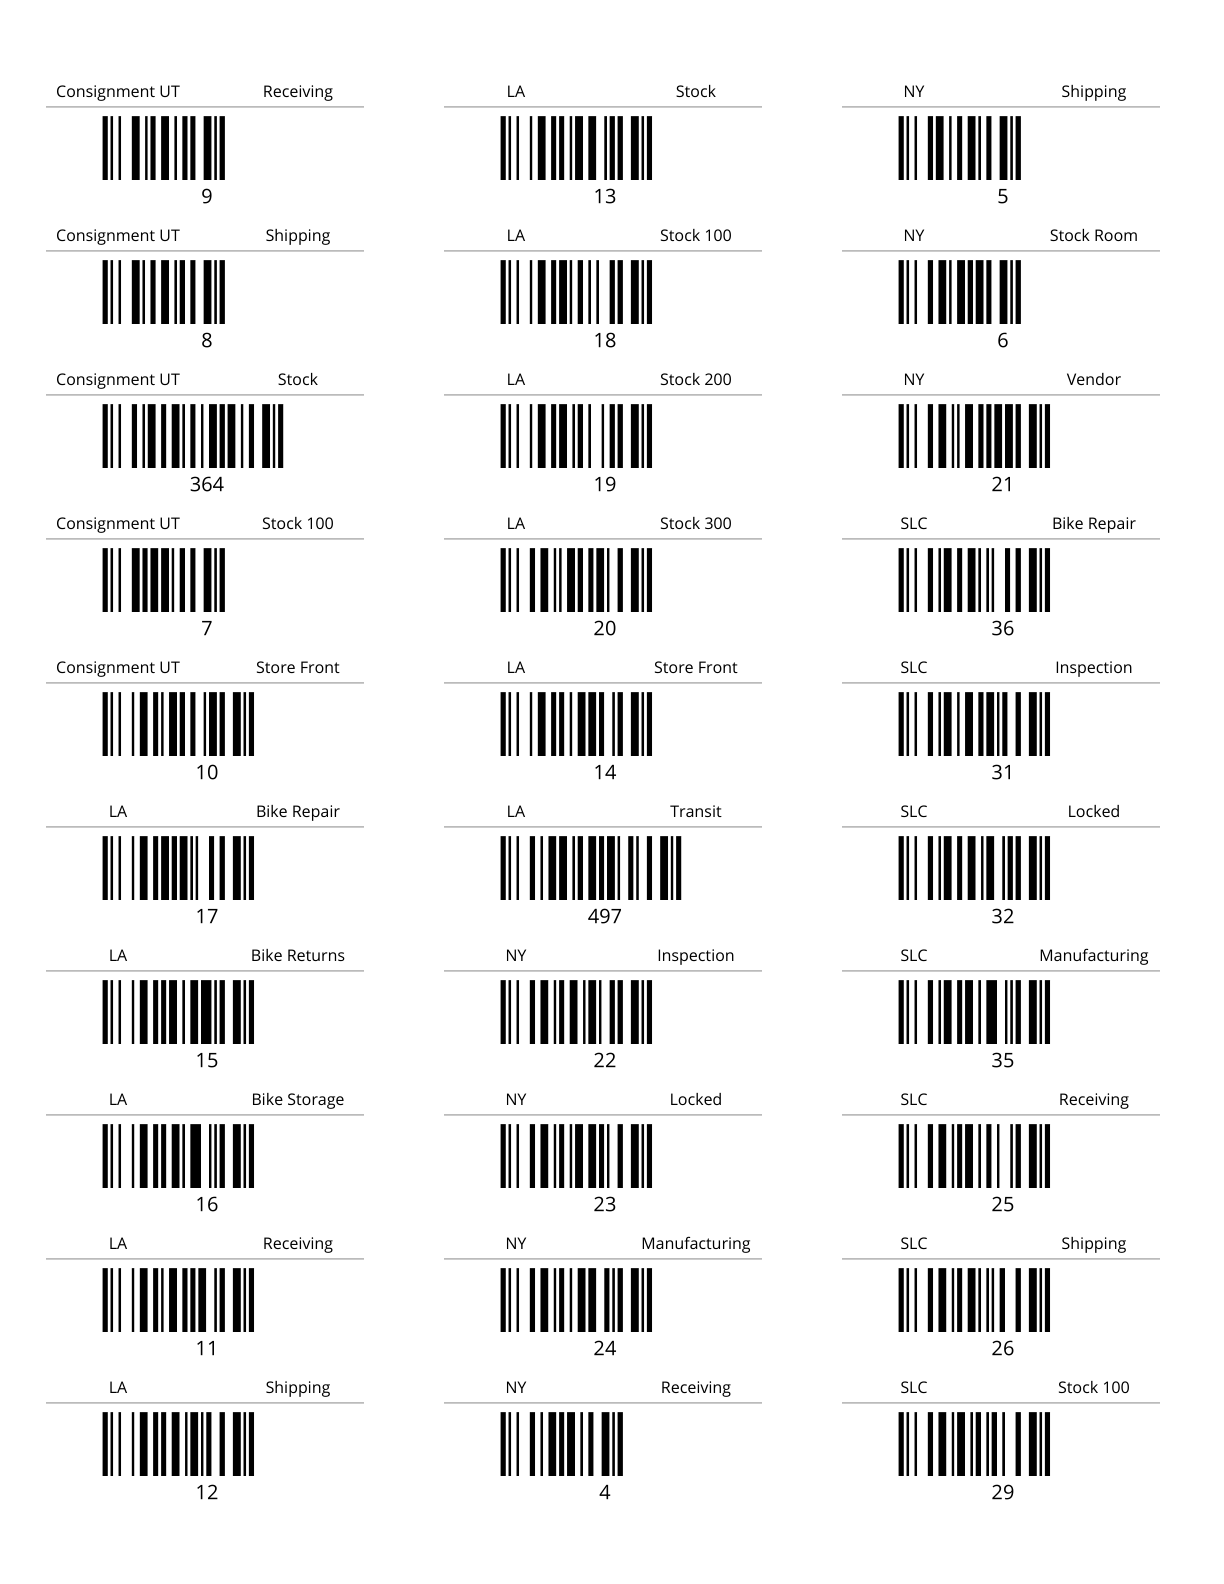
Location Barcode One Off - Location barcodes (Code 128) for Avery 8160 Labels.

New Tags - New Tags for Avery 8160 Labels.
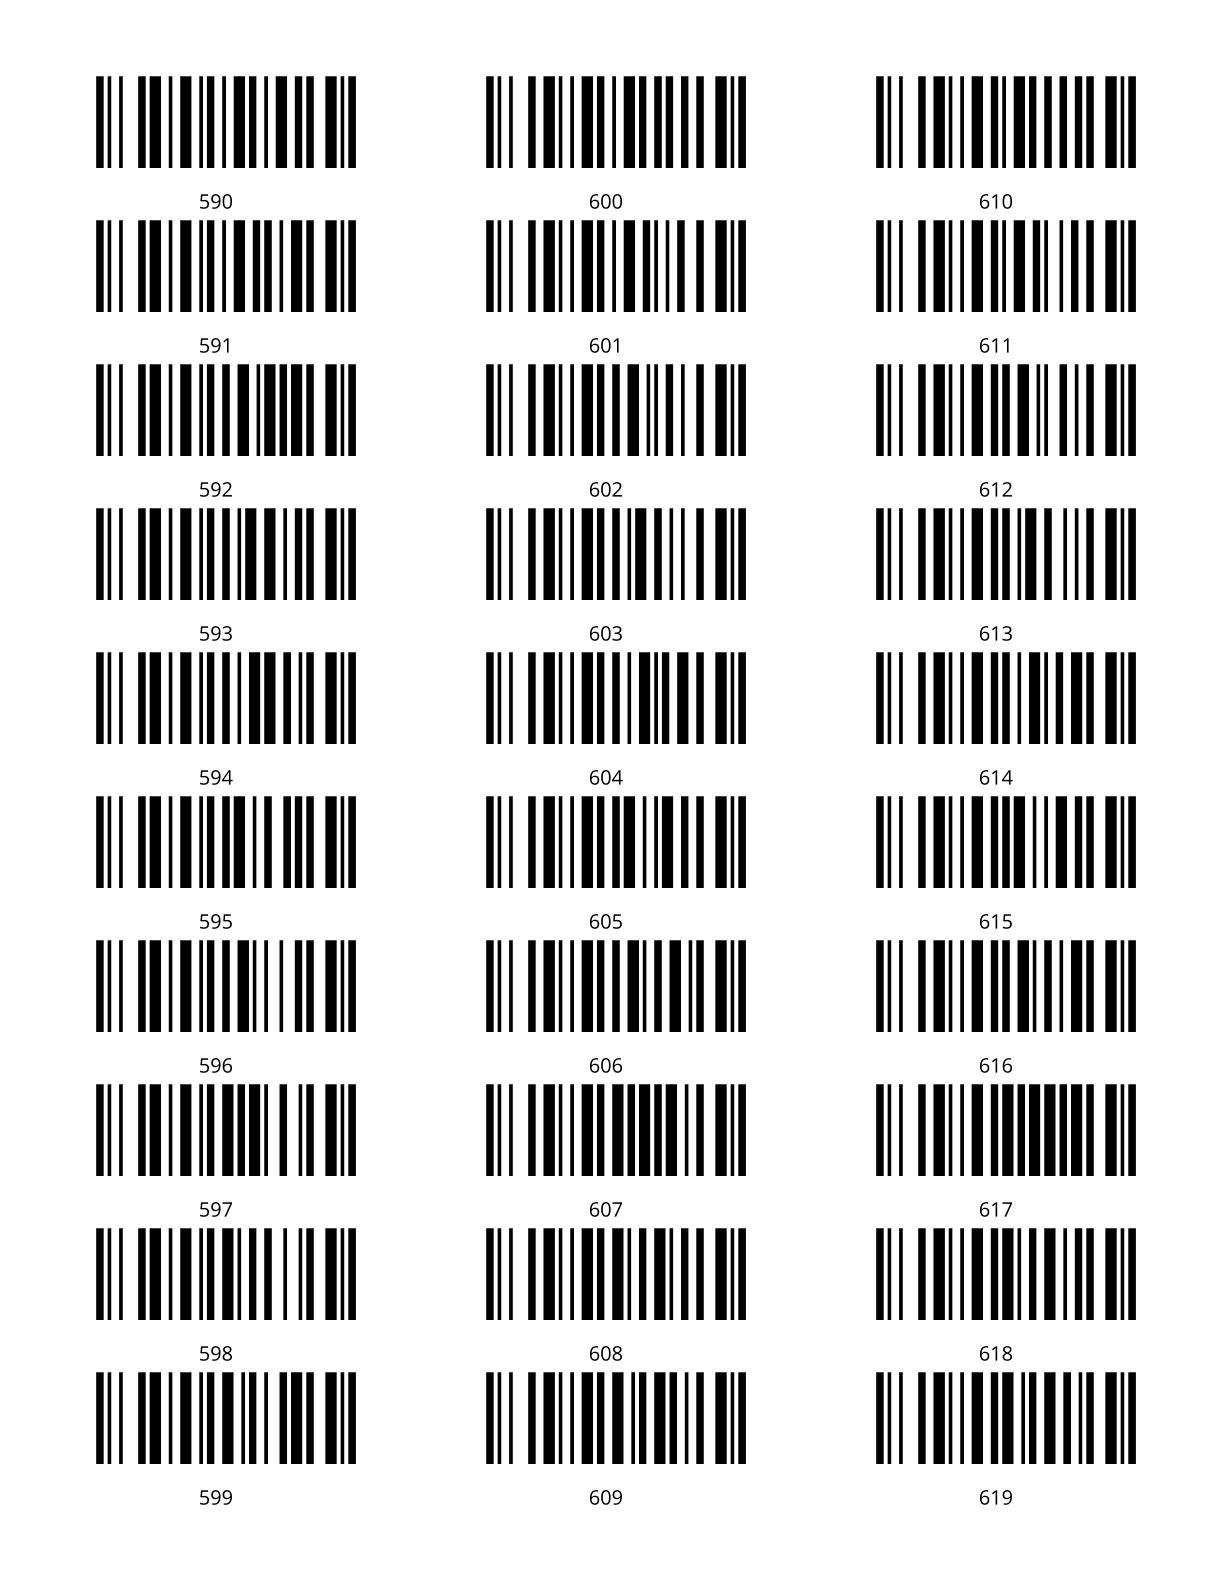
New Tags One Off - New tags for one off labels.

New Tracking - New tracking labels for Avery 8160 Labels.
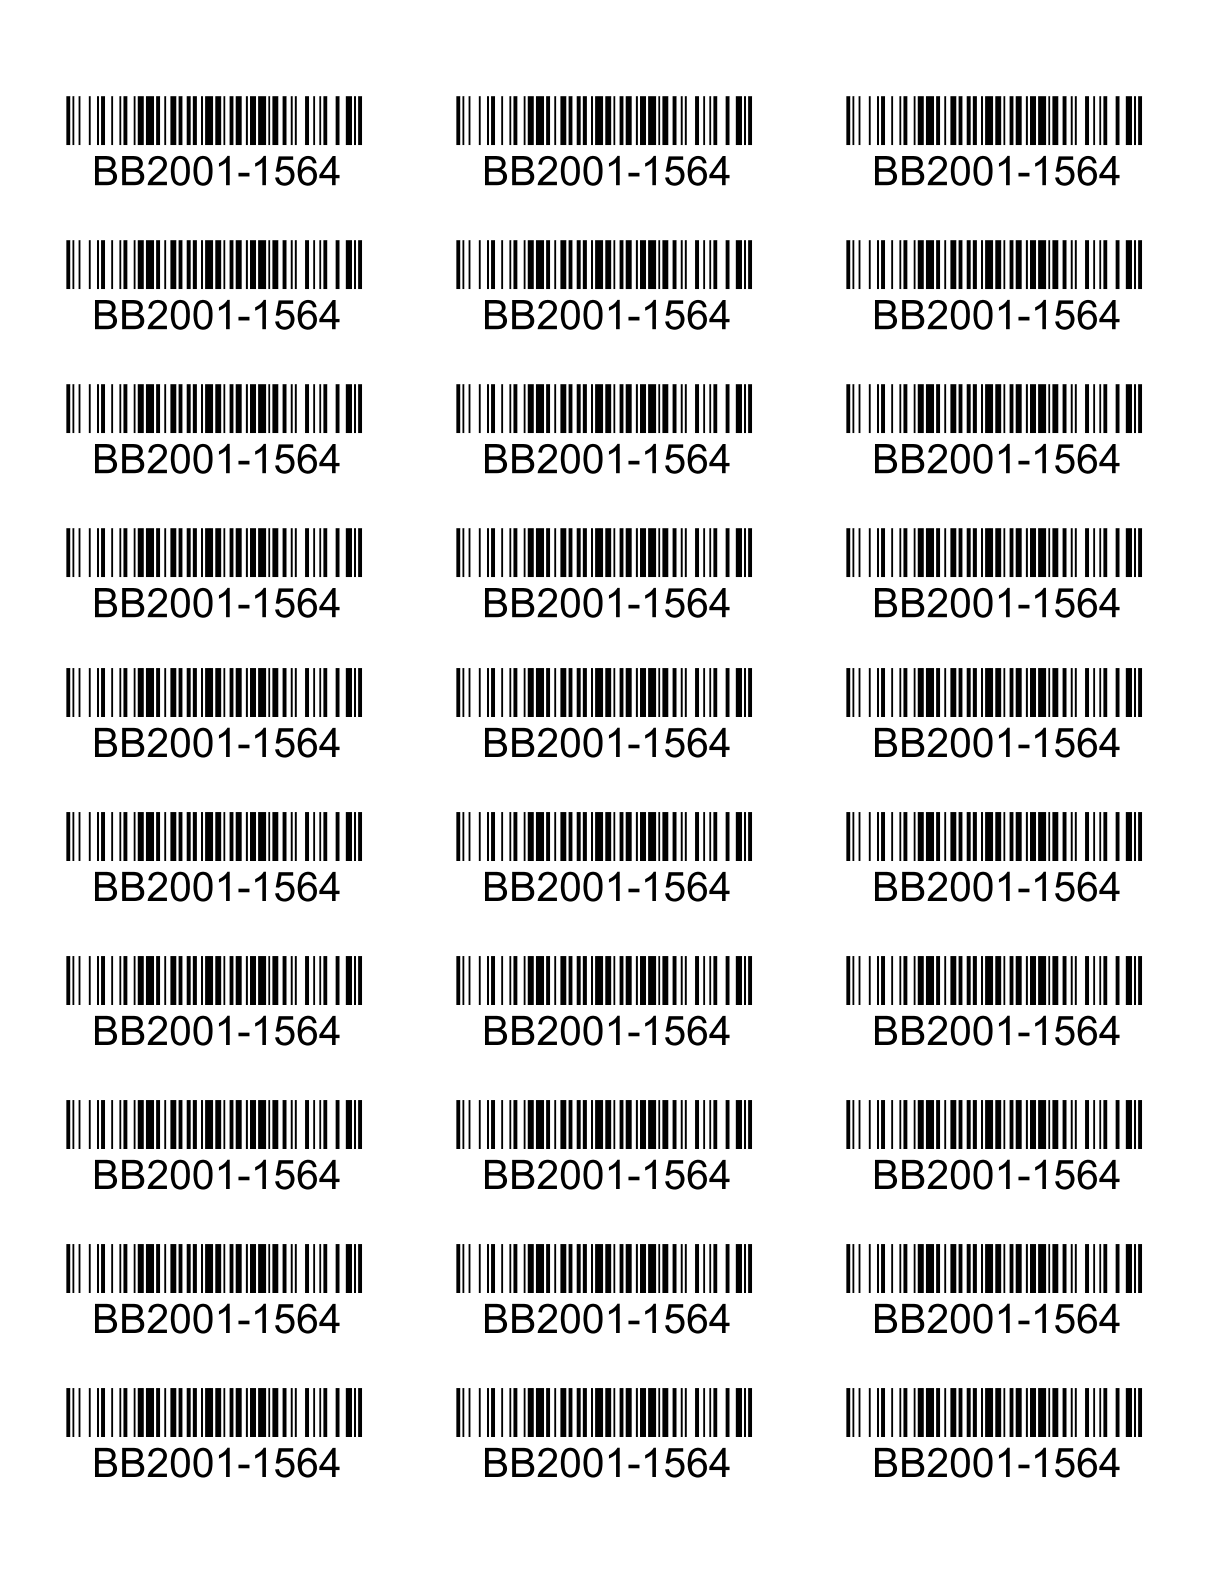
New Tracking Incremental - New Incremental Tracking for Avery 8160 Labels.
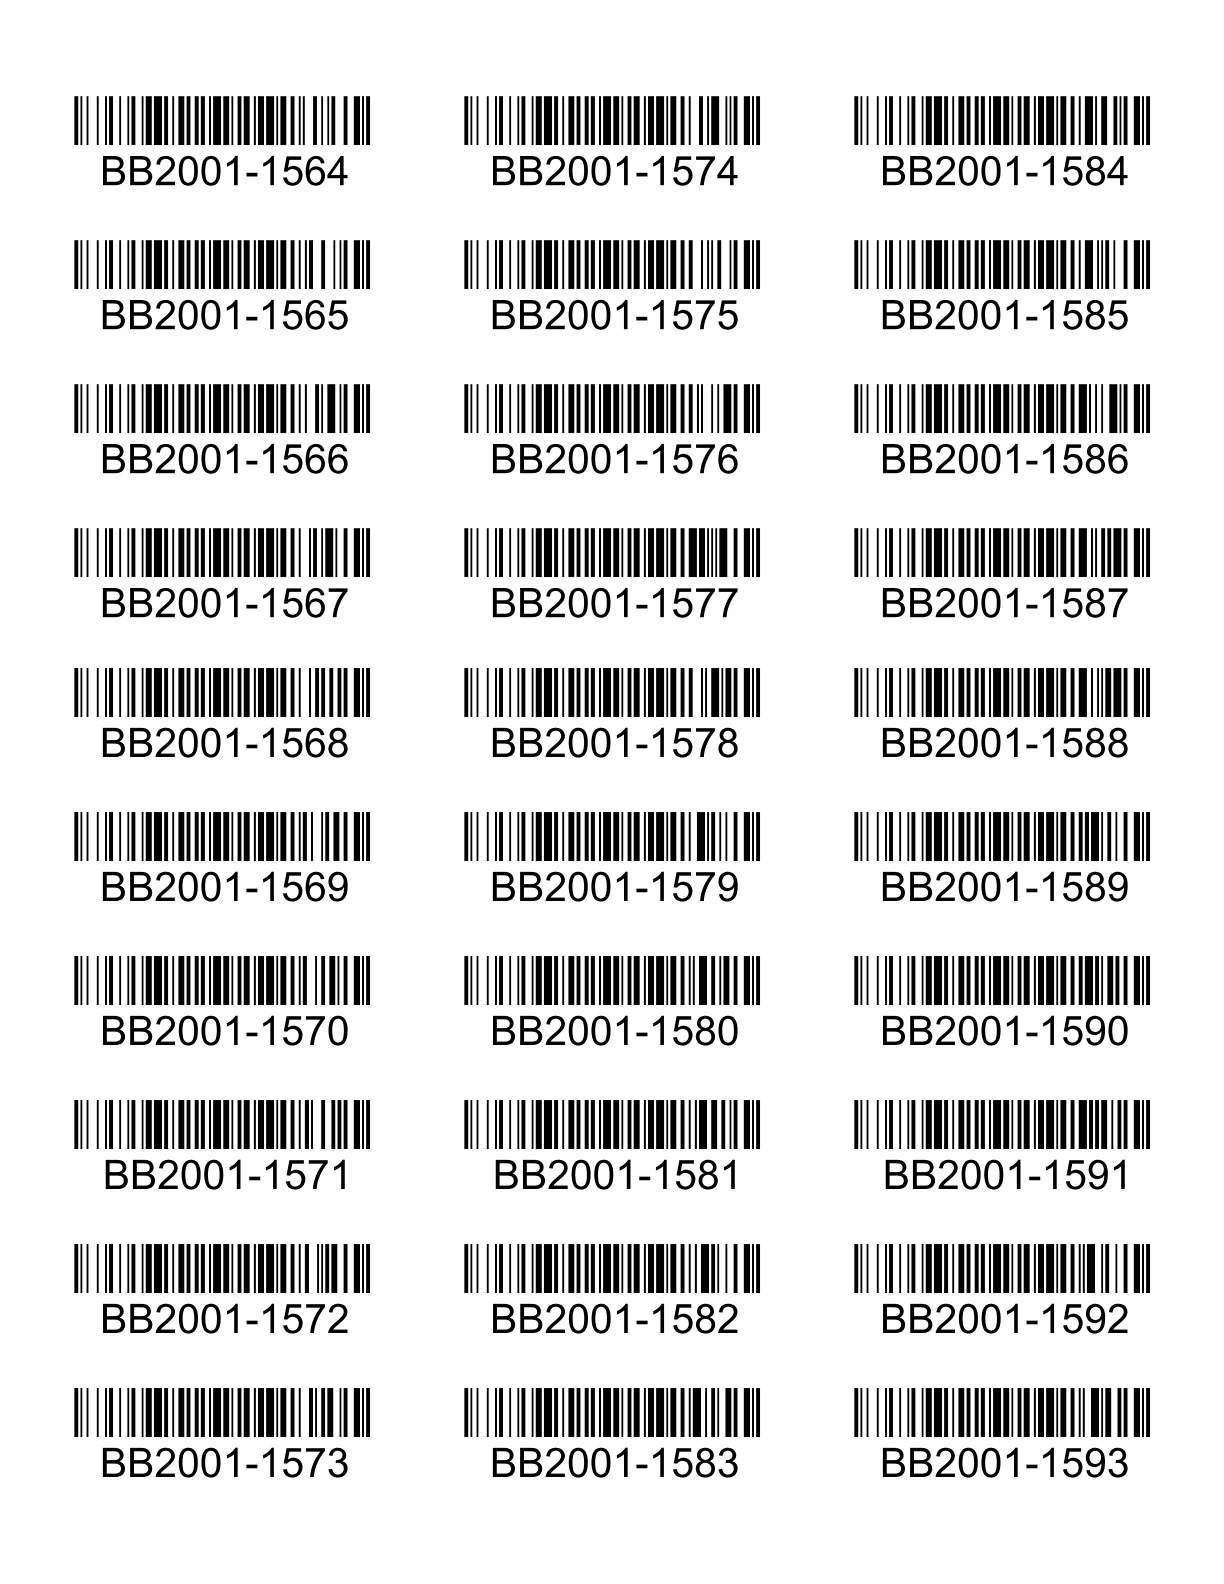
New Tracking Incremental One Off - New Incremental Tracking one off Labels.

New Tracking One Off - New tracking for one off labels.

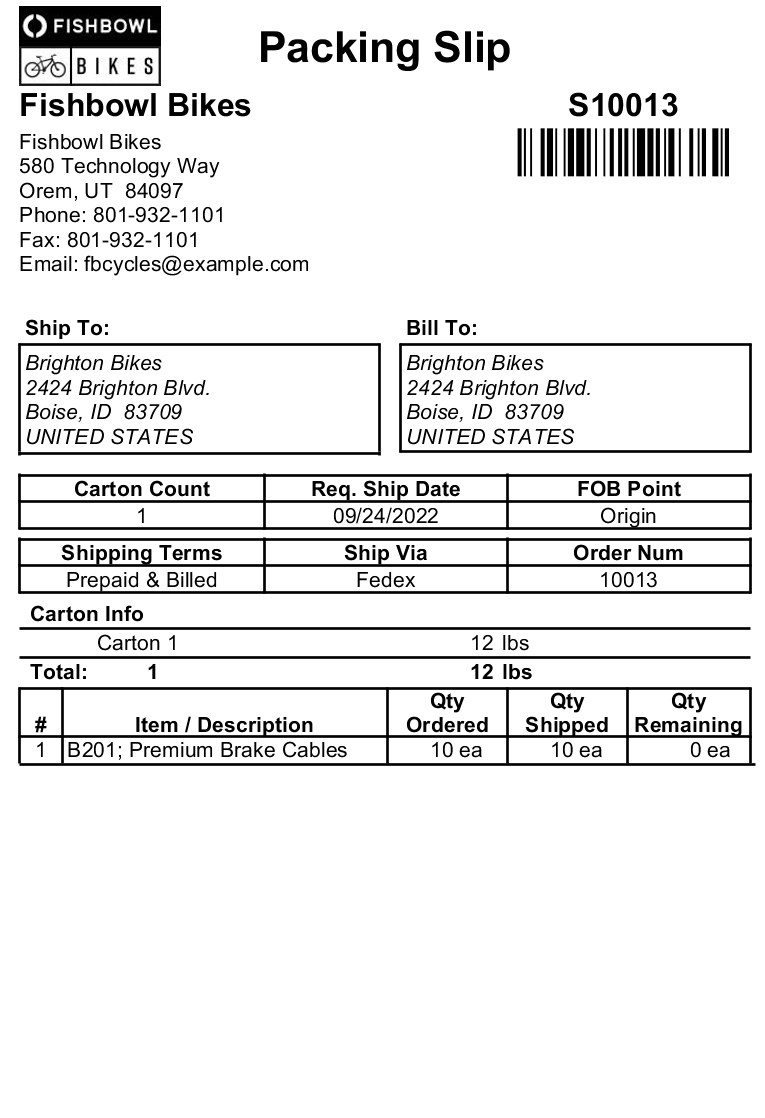
Packing Slip 4x6 - Prints 4x6 Packing Slip Labels.
Part Barcodes Avery - Part barcodes (Code 128) for Avery 8160 Labels.
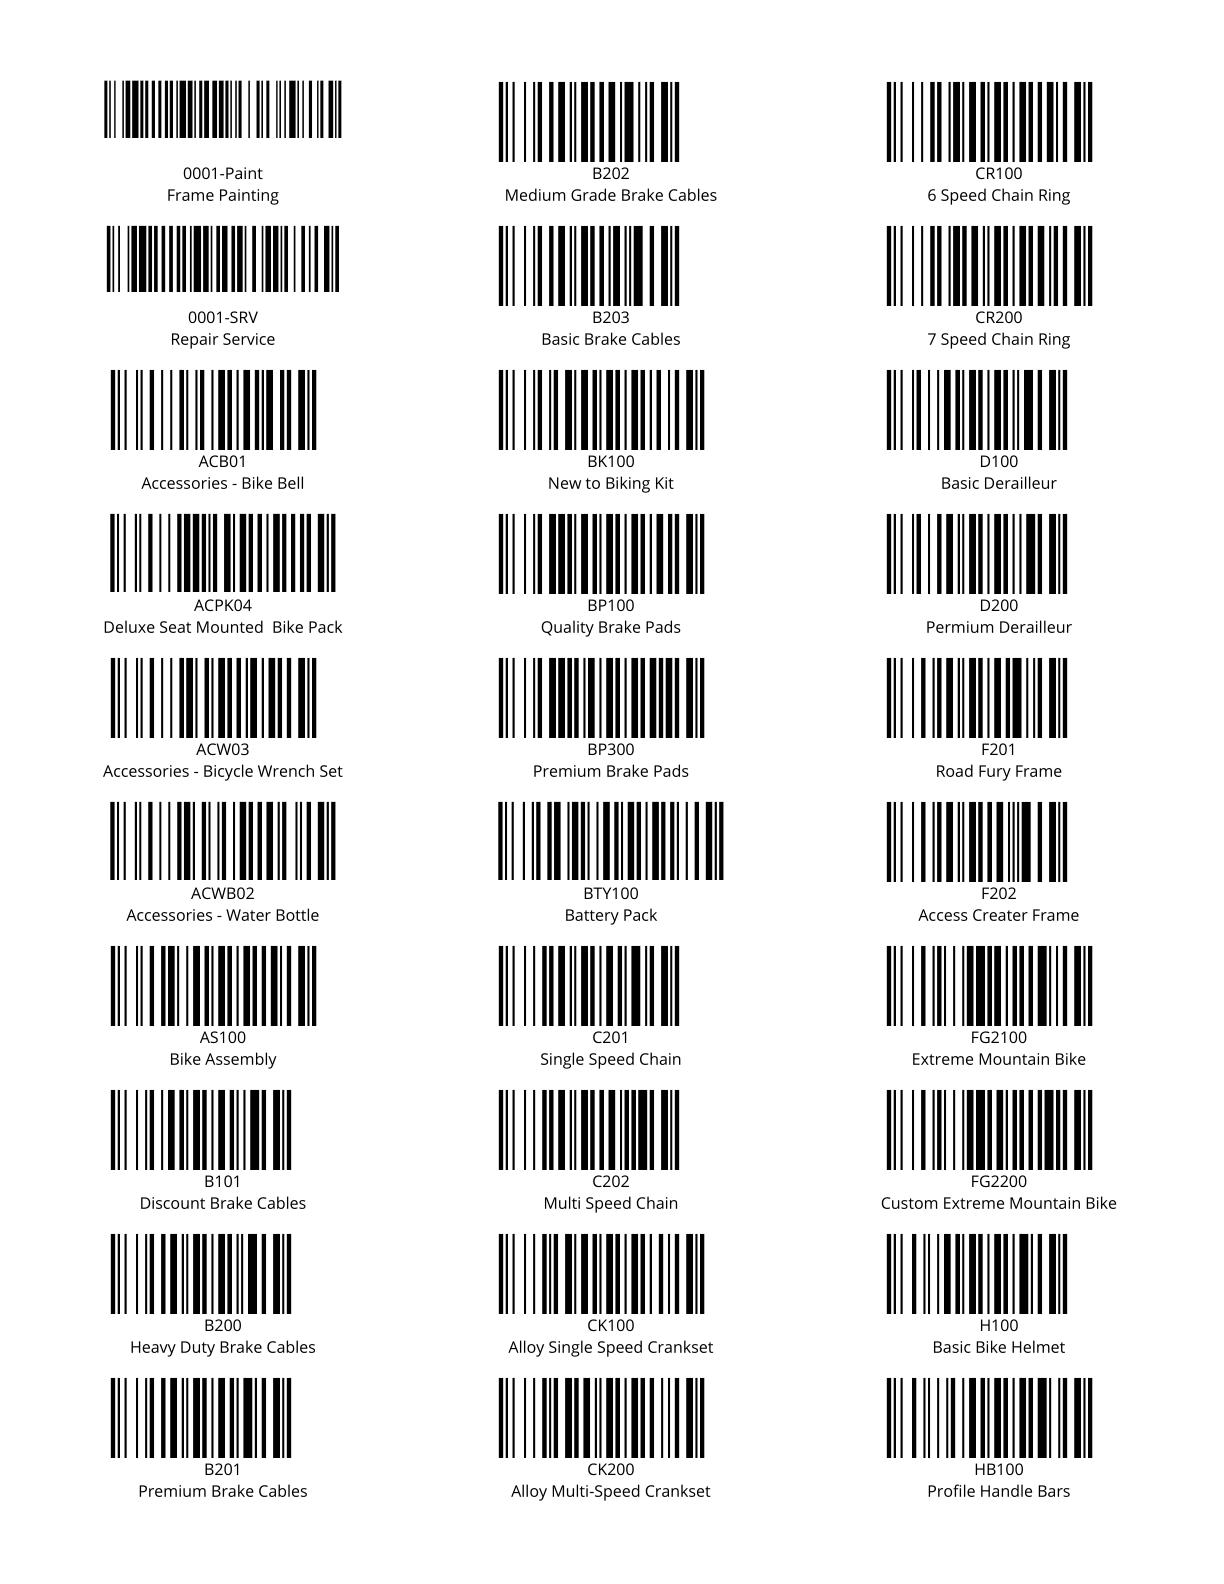
Part Barcodes By PO Avery - Prints All Product barcodes (Code 128) for a given PO. Formatted for Avery 8160 Labels.

Part Barcodes By PO One Off - Prints All Product barcodes (Code 128) for a given PO. Formatted for One Off 2 x 1 labels.

Part Barcodes One Off - Part barcodes (Code 128) for one off Labels.

Part Barcodes With Tracking One Off - Part Barcodes for one off Labels. One label will print for each primary part tracking number (or quantity if no tracking exists) from a specific location.

PO Part Barcodes With Tracking One Off - Part barcodes (Code 128) for one off Labels. Prints one label for each part and distinct tracking value received in a specified Purchase Order. Requires a primary tracking.
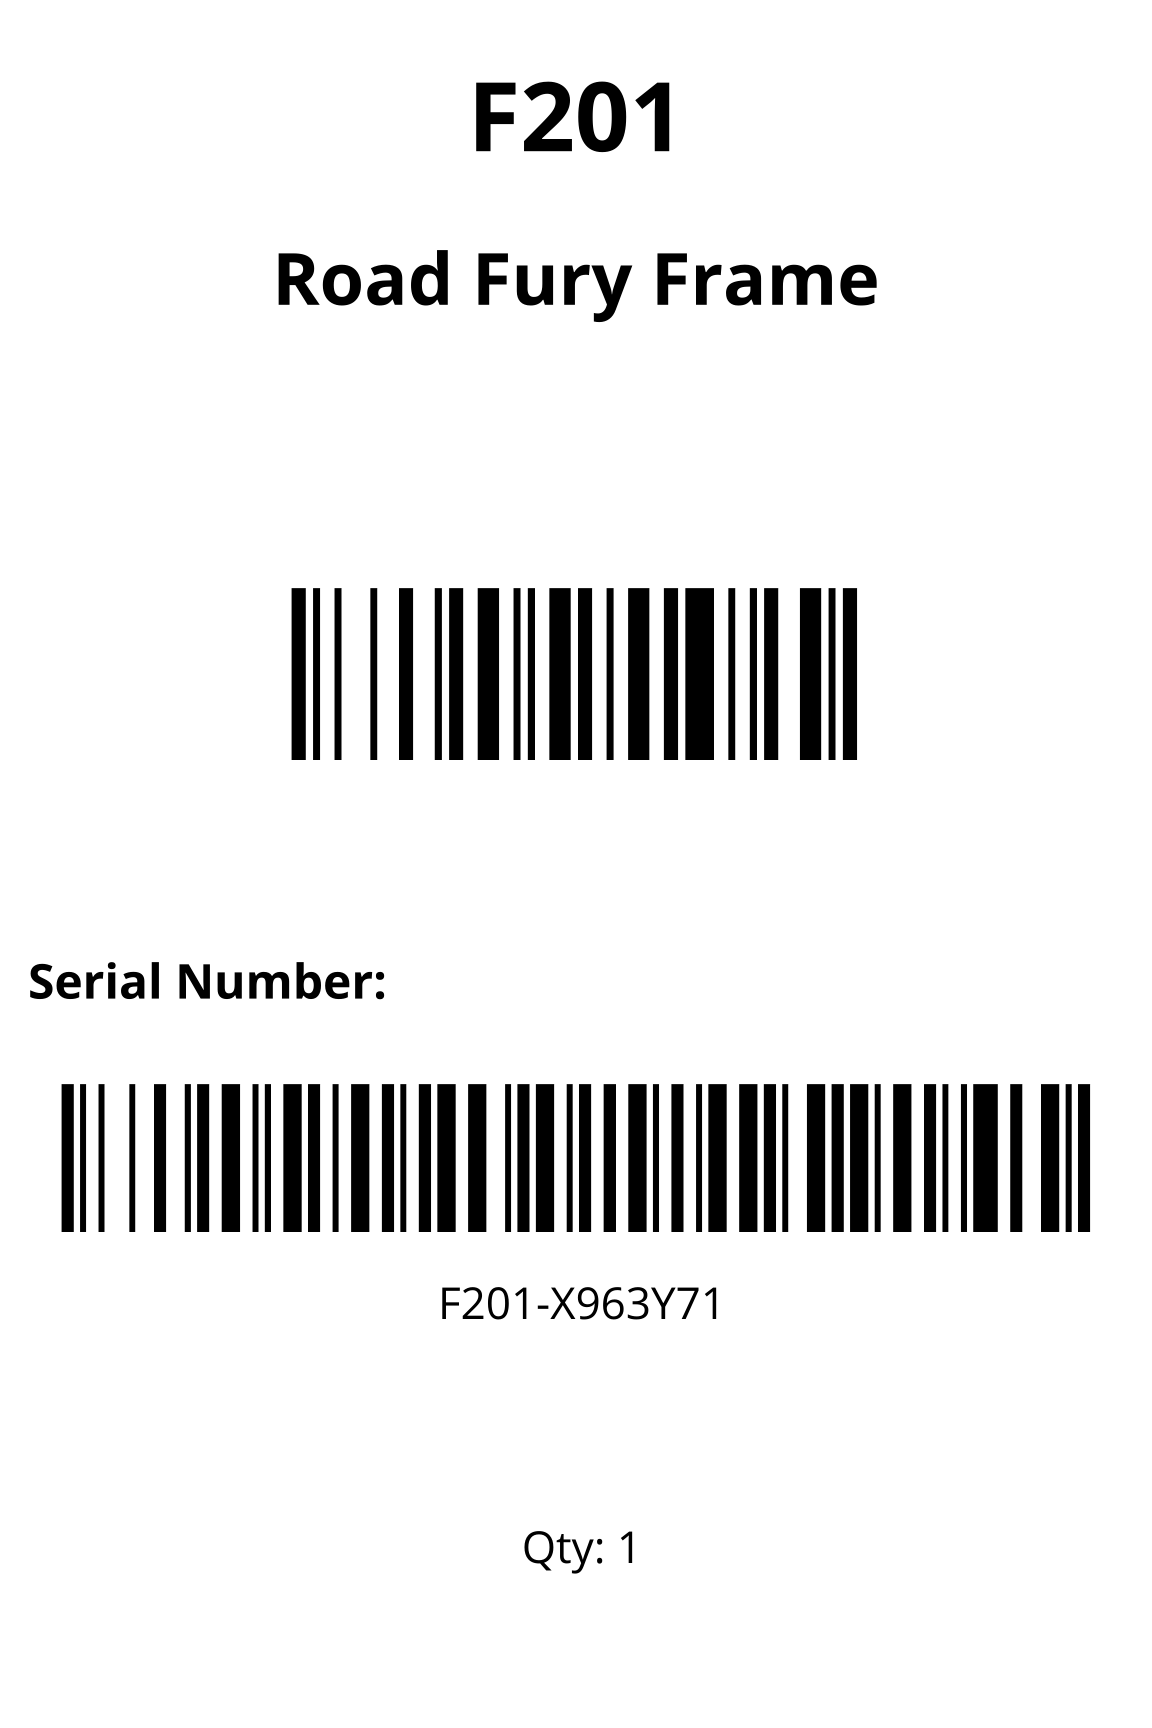
Product Barcodes Avery - Product barcodes (Code 128) for Avery 8160 Labels.

Product Barcodes By Receipt Avery - Prints Product barcodes (Code 128) for items received on a specific date. Formatted for Avery 8160 Labels.

Product Barcodes By Receipt One Off - Prints Product barcodes (Code 128) for items received on a specific date. Formatted for One Off 2 x 1 labels.
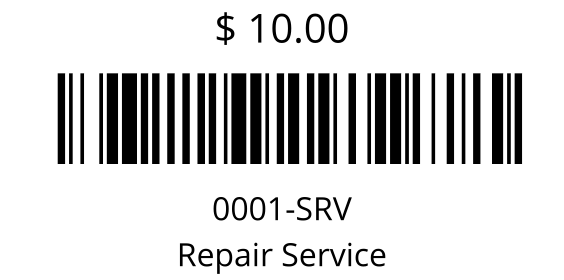
Product Barcodes By SO Avery - Prints All Product barcodes (Code 128) for a given PO. Formatted for Avery 8160 Labels.

Product Barcodes By SO One Off - Prints All Product barcodes (Code 128) for a given PO. Formatted for One Off 2 x 1 labels.

Product Barcodes One Off - Product barcodes (Code 128) for one off Labels.
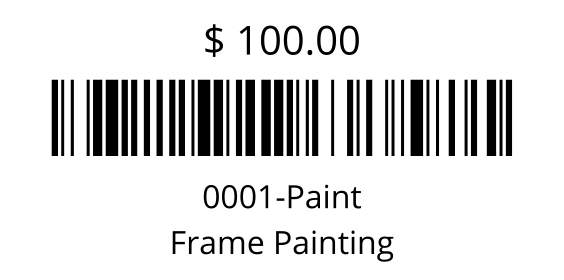
Receiving Label - Prints a label for all parts received with their tracking information.
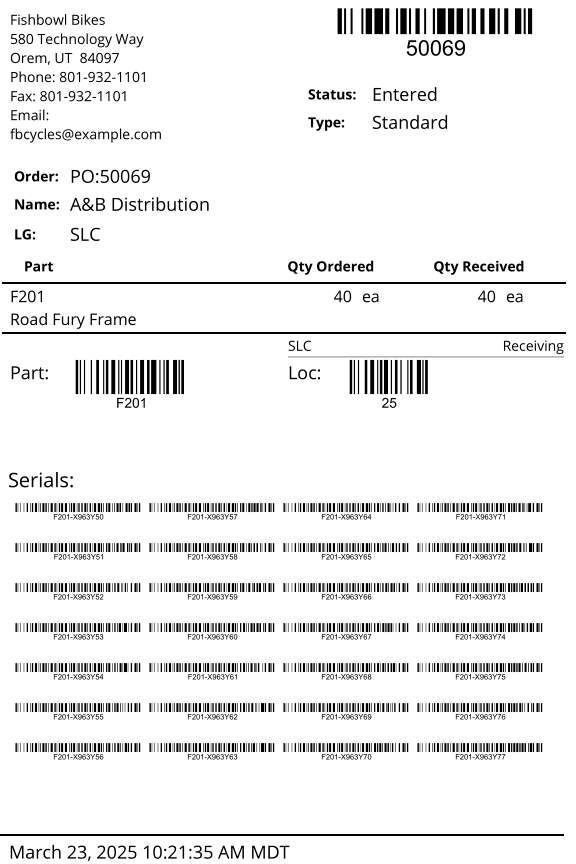
Single Part Barcodes Avery - Part barcodes (Code 128) for Avery 8160 Labels.

Single Product Barcodes Avery - Product barcodes (Code 128) for Avery 8160 Labels.
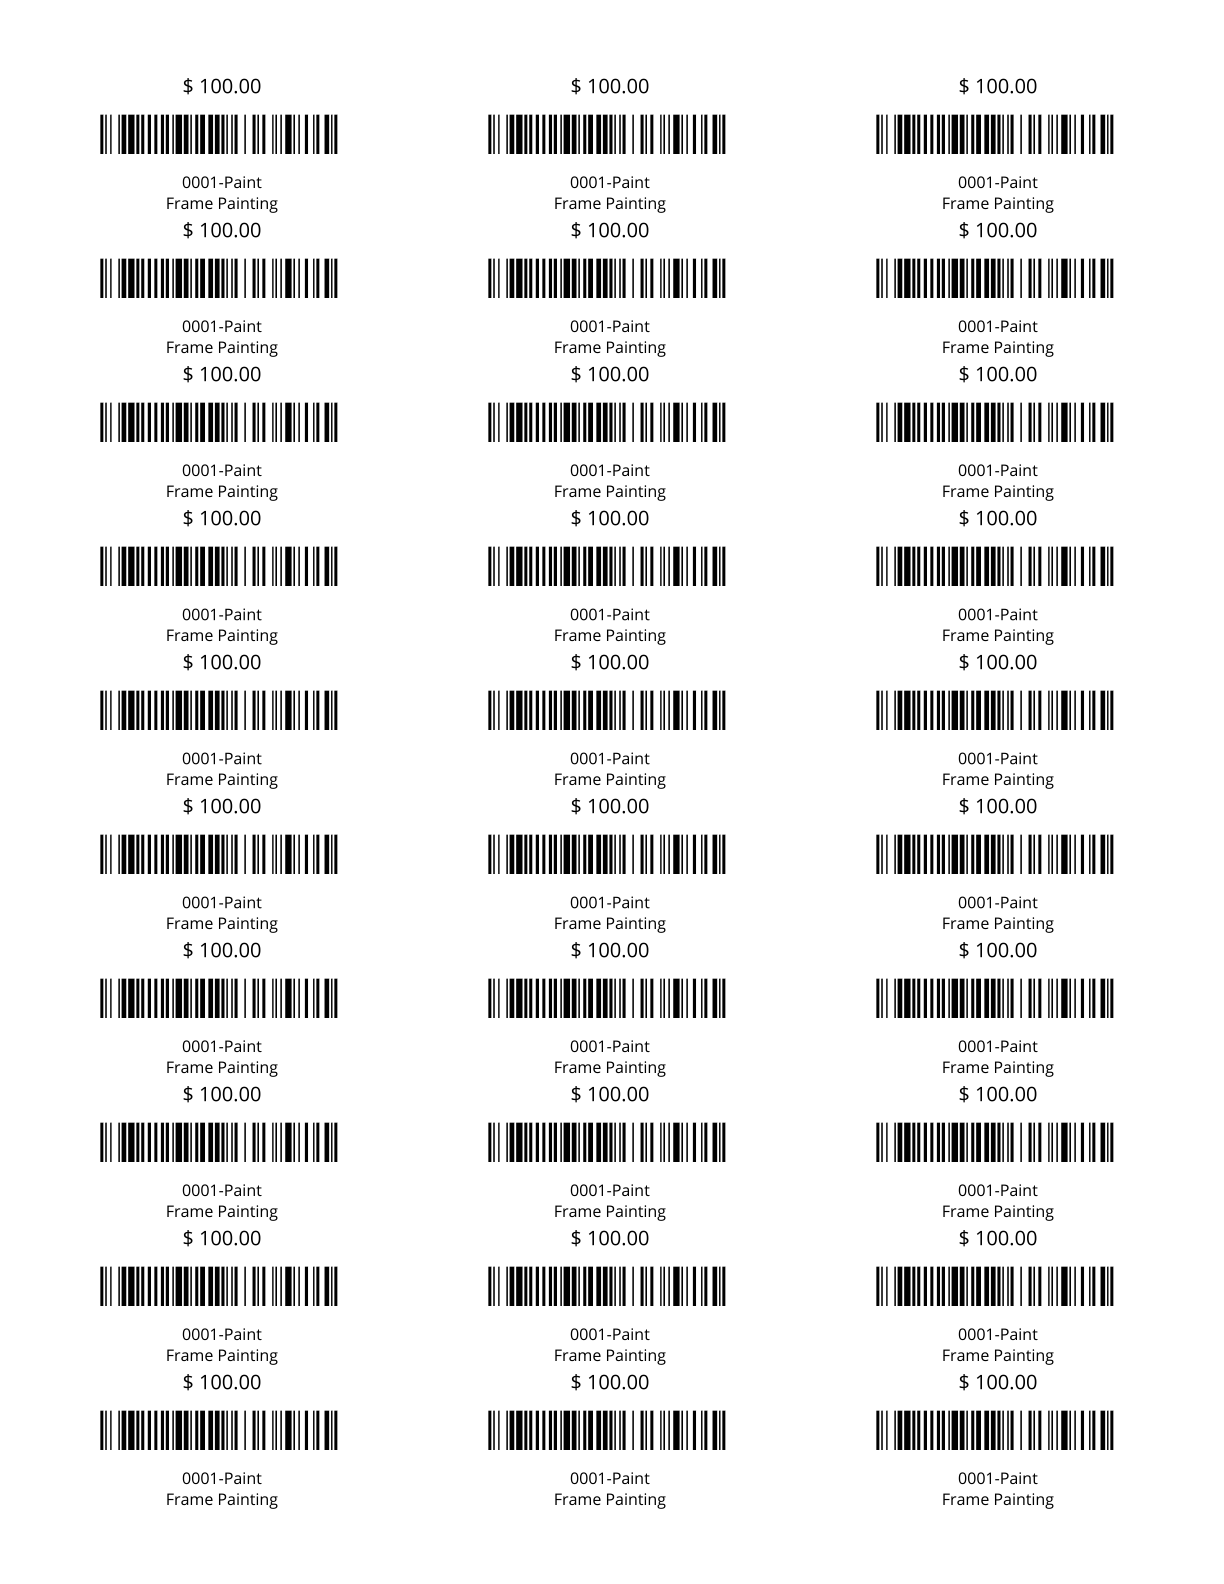
Tag Barcodes Avery - Tag barcodes (Code 128) for Avery 8160 Labels.
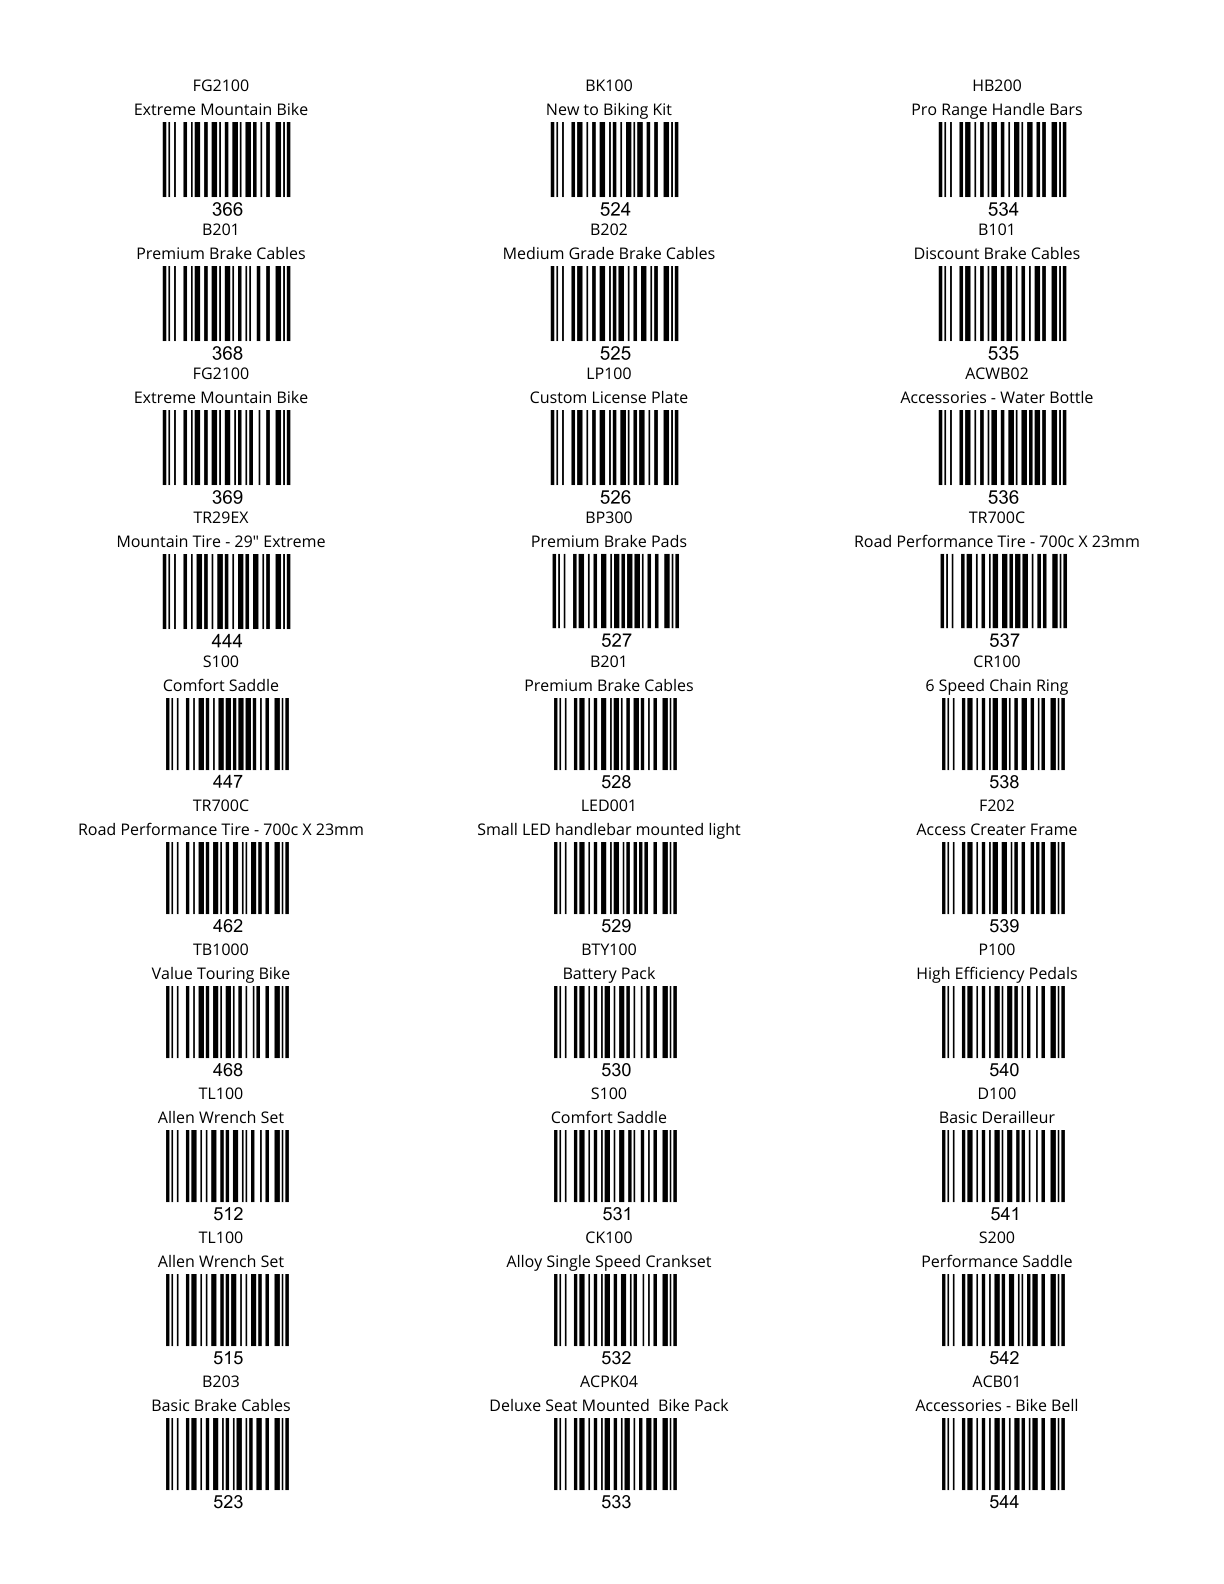
Tag Barcodes One Off - Tag barcodes (Code 128) for one off Labels.
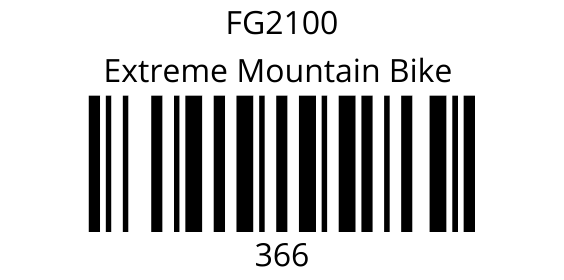
UPS Label - Tracking Label for UPS.

UPS Return Label - Return Tracking Label for UPS.
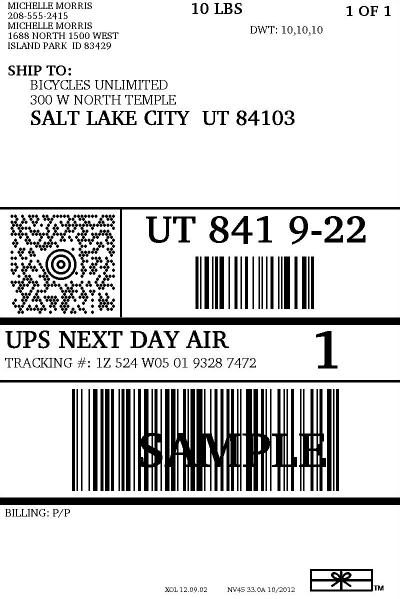
Vendor Address Labels - Vendor Address Labels for Avery Labels.

Vendor Part Barcodes - Part barcodes (Code 128) for Avery Labels.

Vendor Part Barcodes One Off - Part barcodes (Code 128) for one off Labels.

Walmart Label - Standard Walmart shipping label. This label will check for a "Store #" custom field on the SO, or you can override this by entering a store number in the Modify Report section.

WO Part Barcodes With Tracking One Off - Part barcodes (Code 128) for one off Labels. Prints one label for each part and distinct tracking value manufactured in a specified Work Order. Requires a primary tracking method.

|
| Manufacture Order
Available to Build - Shows the quantity of finished goods available to build based on raw good inventory levels.

Manufacture Order Projected Cost - Displays the manufacture order cost amounts and manufacture order items. Cost of unfulfilled work orders is based on your database costing method. Fulfilled work order costs are your historical cost for the work order.
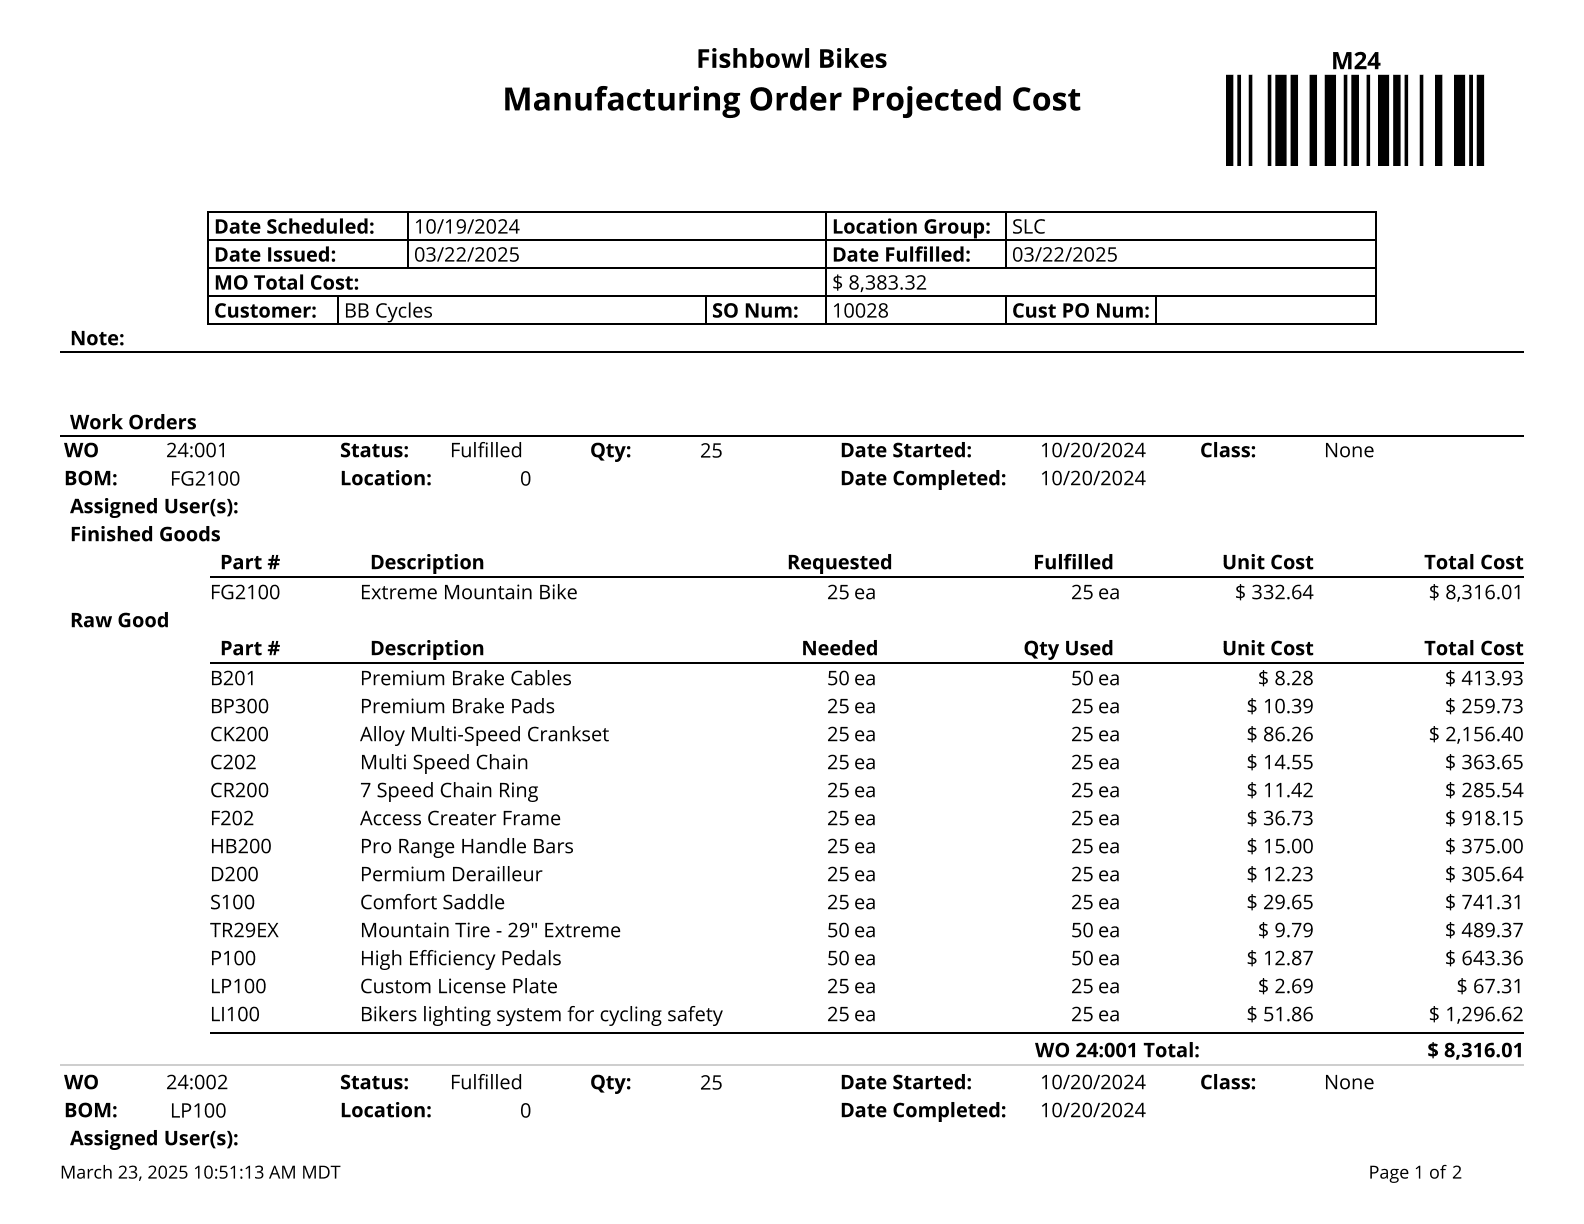
Manufacture Order Stage - Shows the various stages for open work orders. Use % for a wildcard search.
Manufacture Order Traveler - Basic Report for Manufacture Orders.

Production Demand - Shows current demand (allocated to an order) for finished goods in a given date range. It shows demand for each order and also includes a summary by Part Number helping you know exactly what needs to be produced in manufacturing.

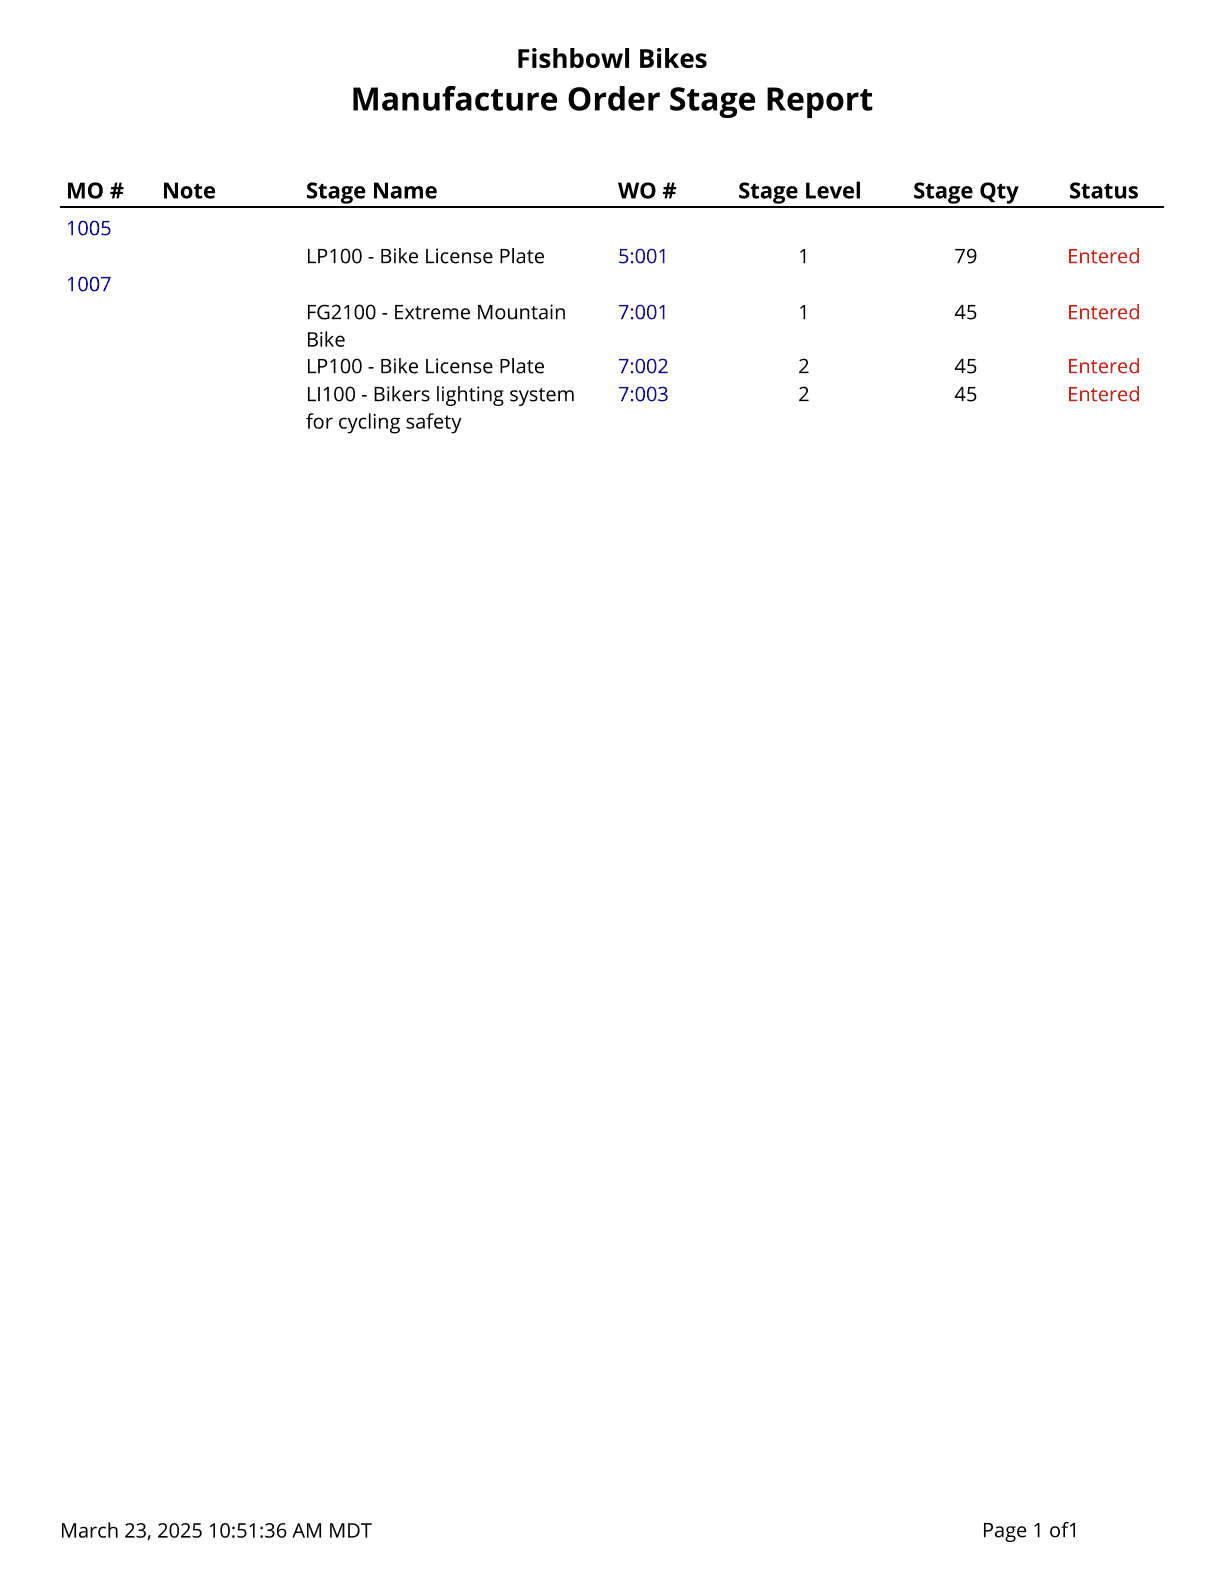
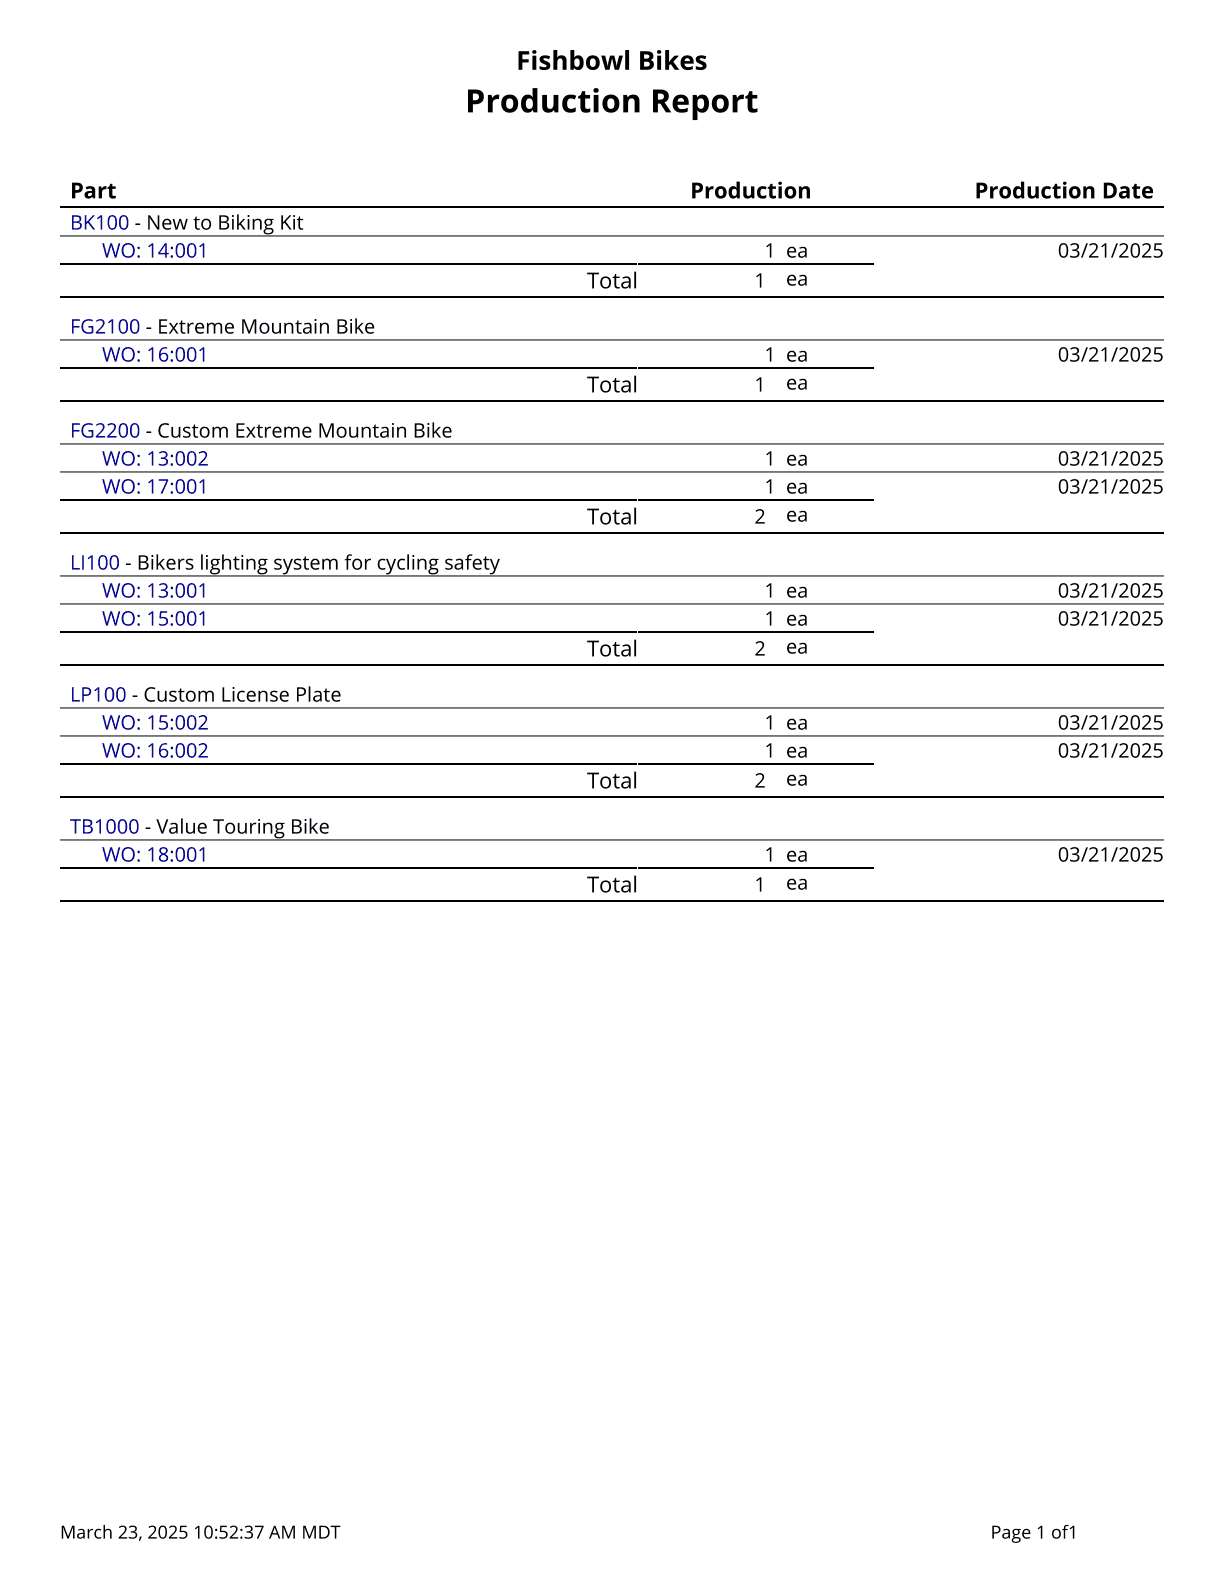
Production Report - Shows the parts built in completed work orders.
|
| Other
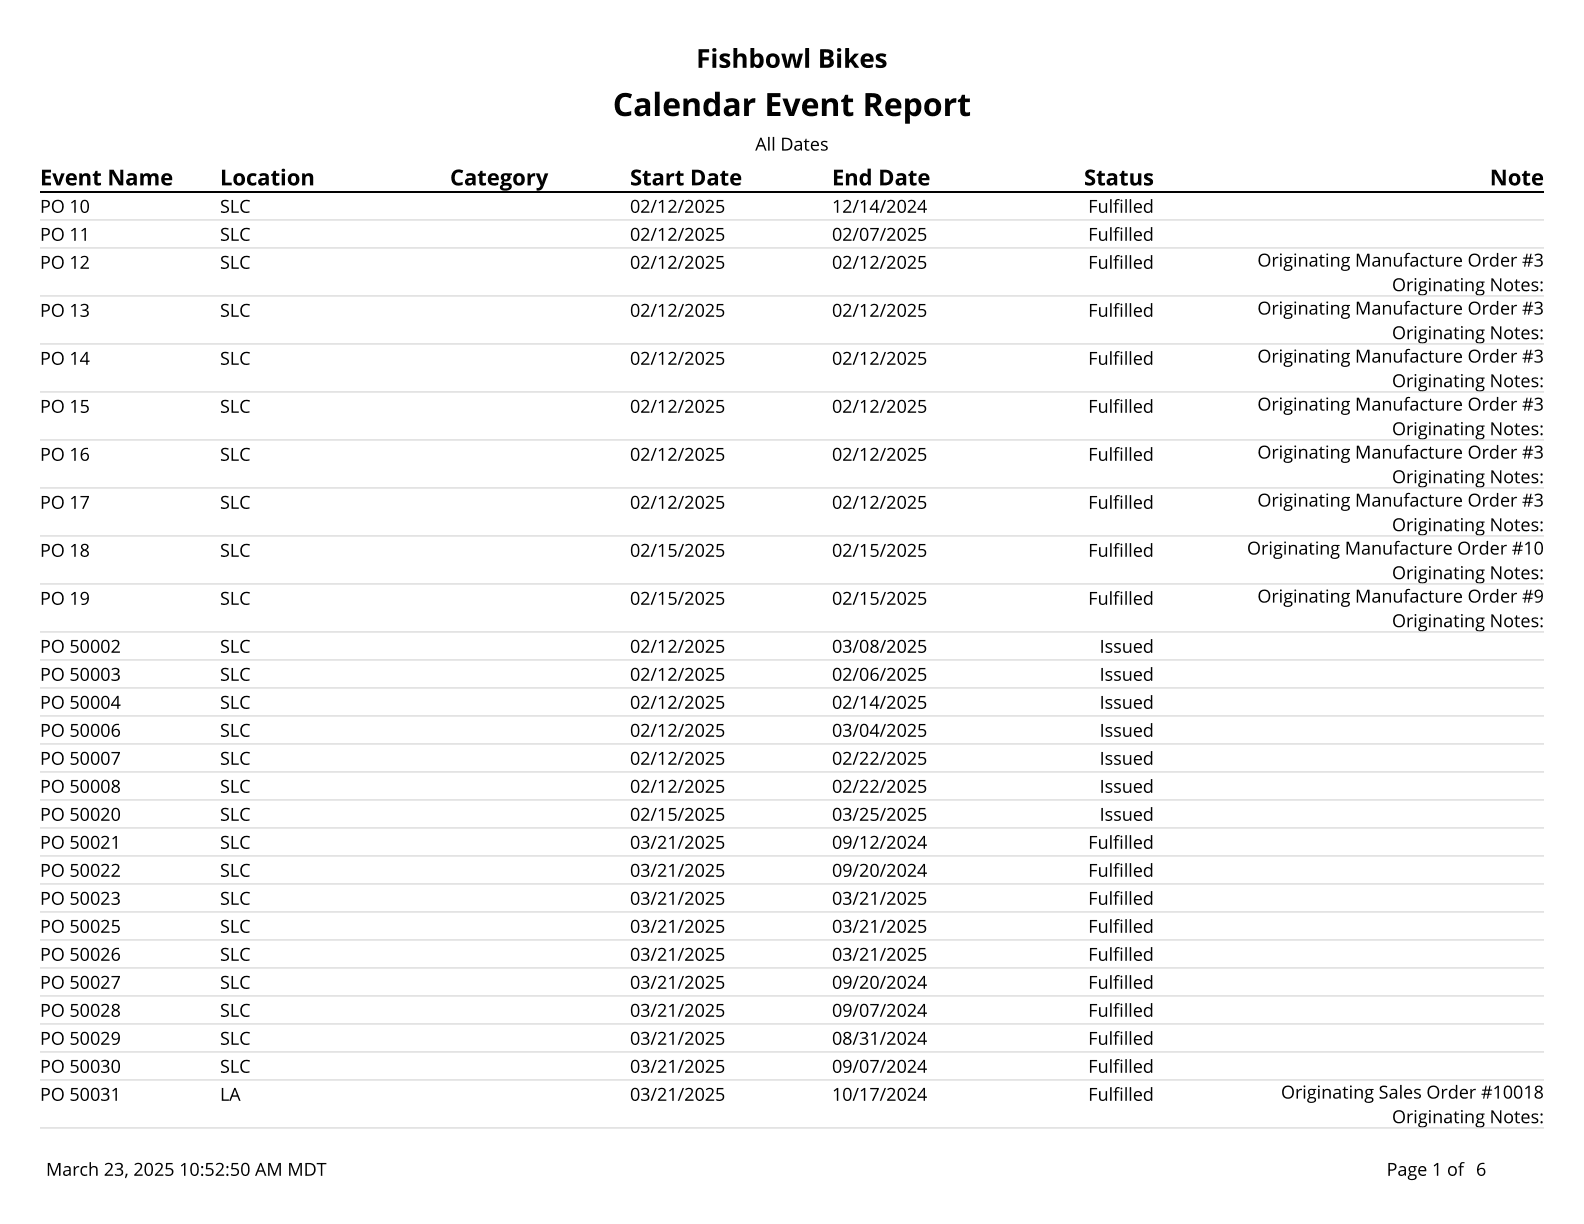
Calendar Report - Report will show all calendar events for a specified date range.
Reports - A list of all Customizable Reports.
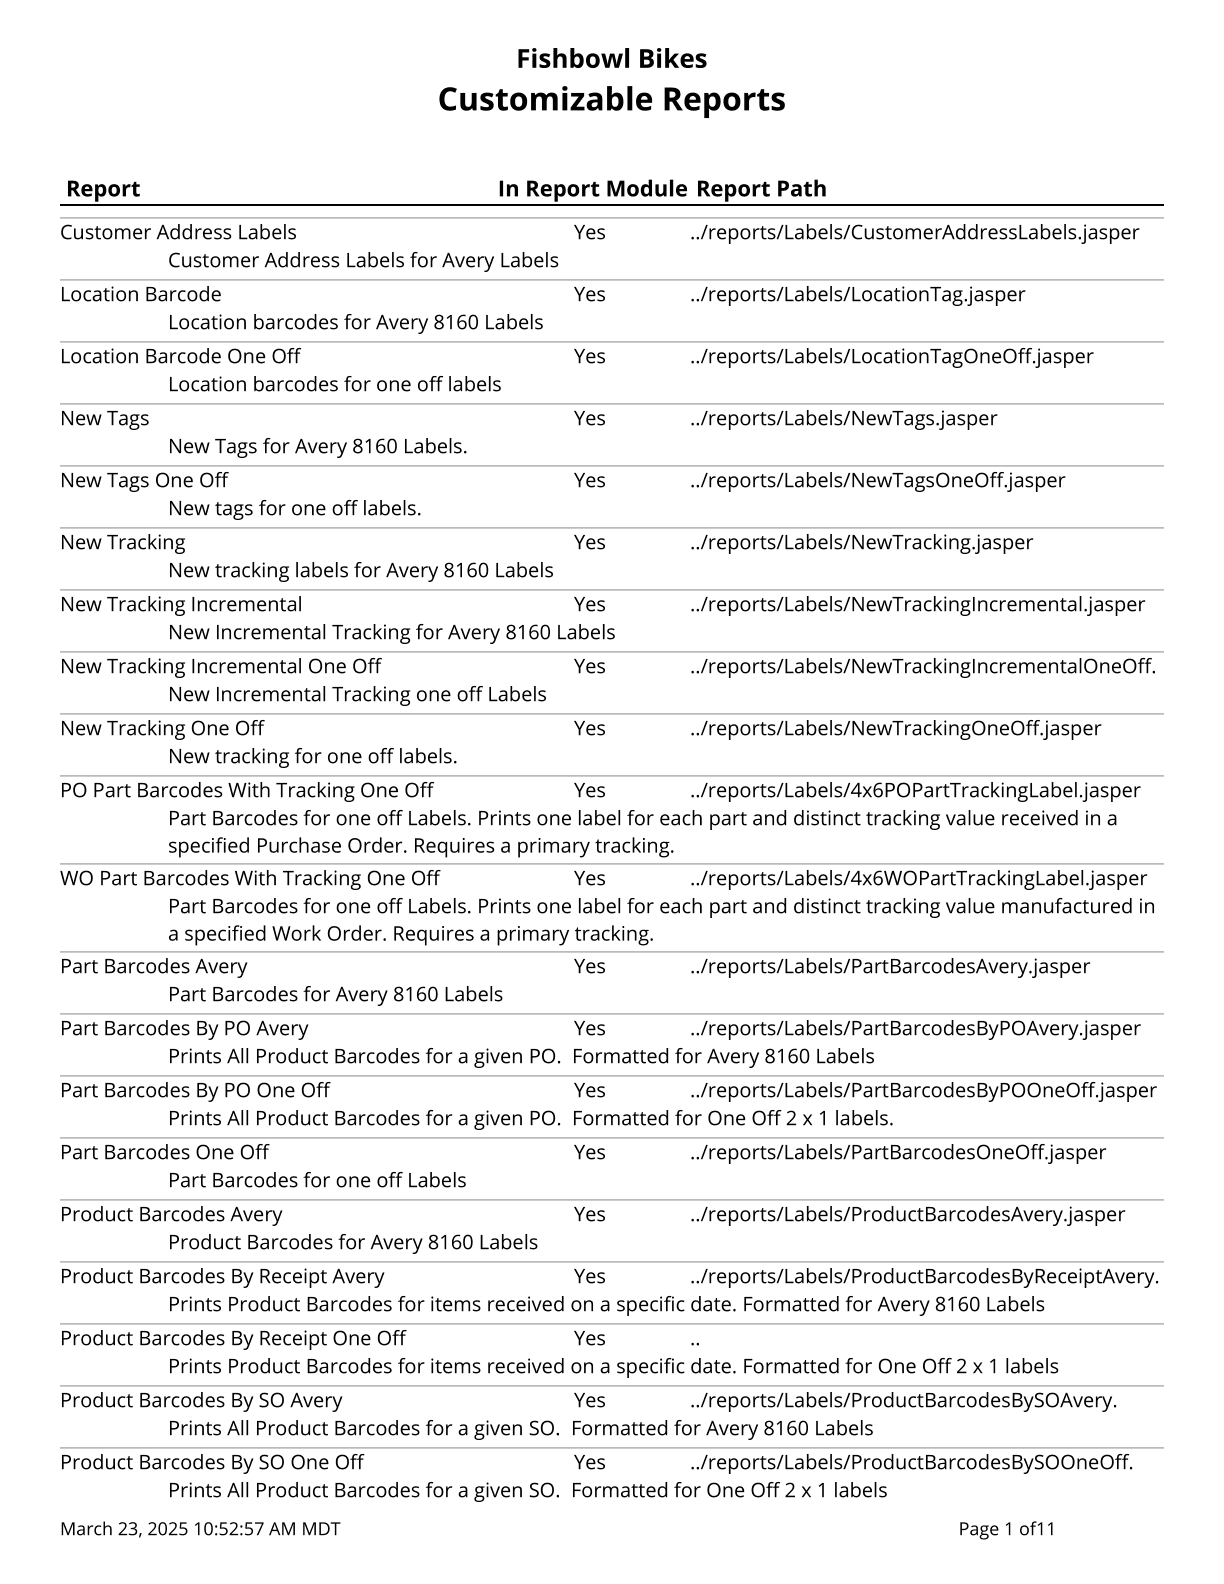
Tracking - Find Parts attached to Tracking Information on Work Orders, Purchase Orders, and Sales Orders.

Tracking Detail - Find Parts attached to Tracking Information on Work Orders, Purchase Orders, and Sales Orders.

|
| Part
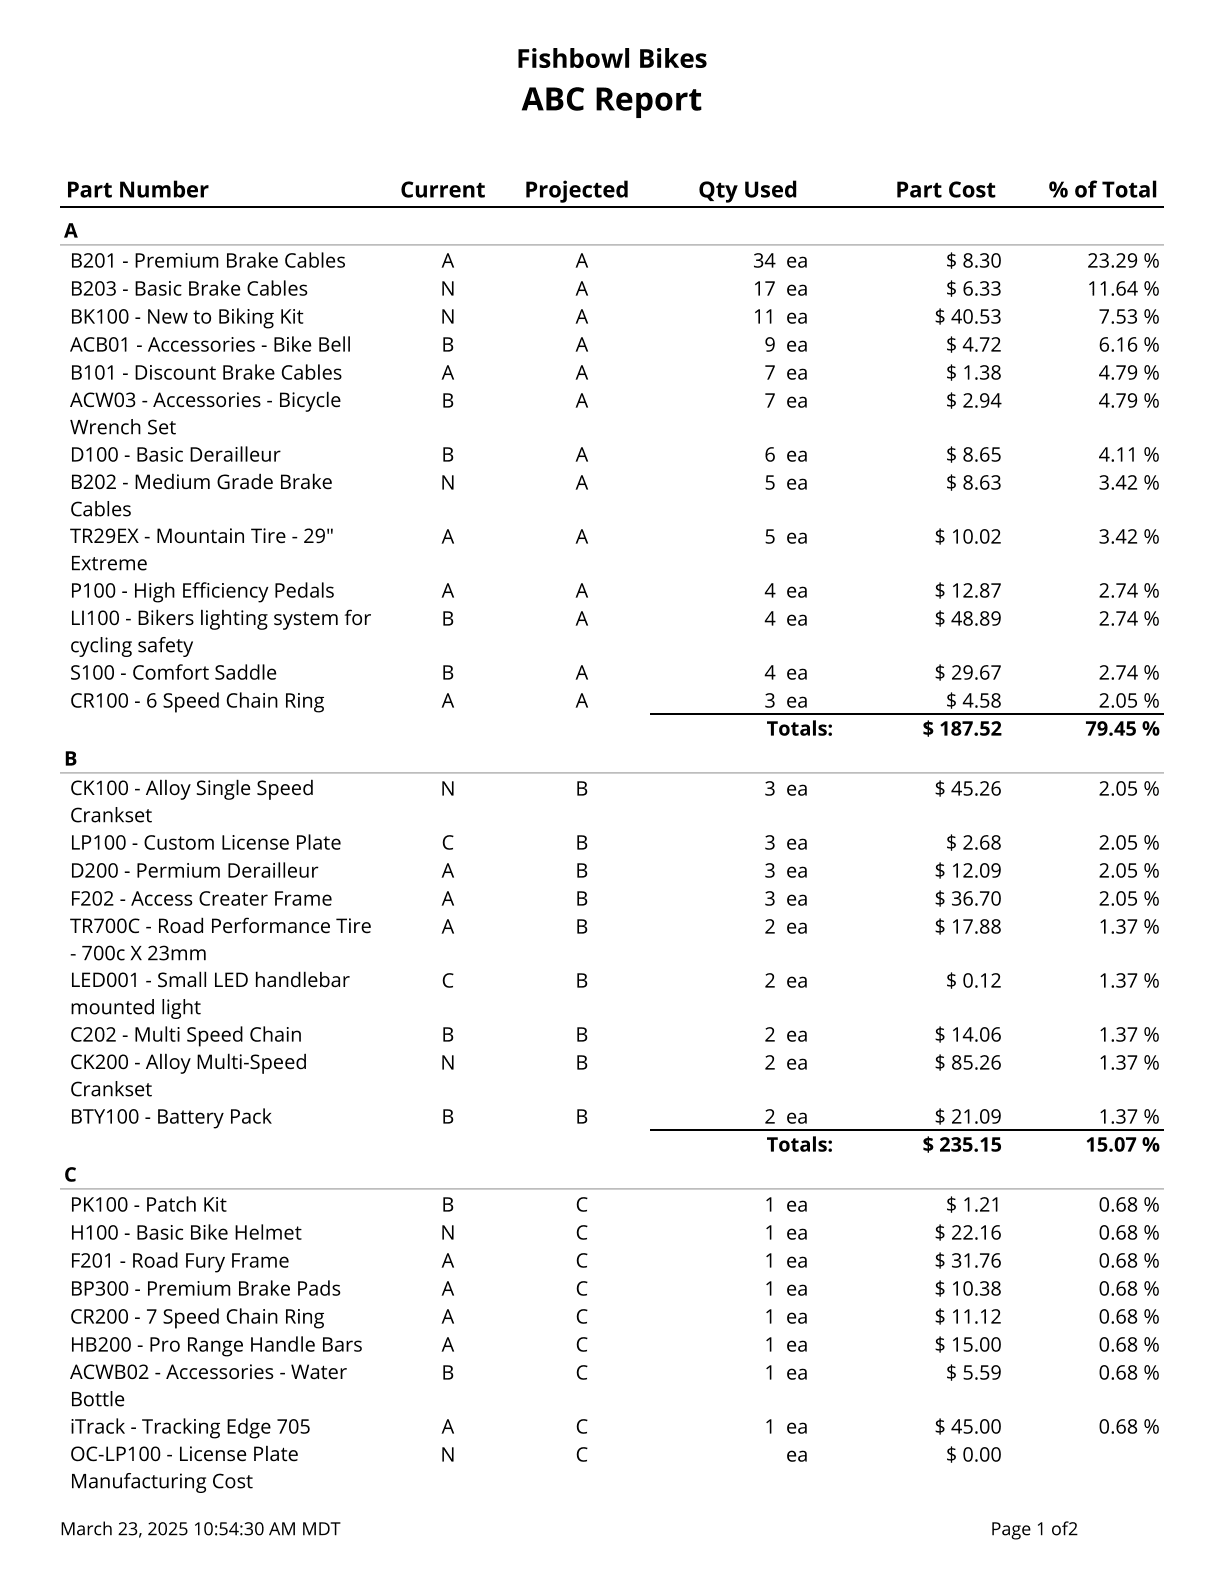
ABC Report - Prints a list of parts, their current ABC Code, and their Projected ABC Code. Cost values are based on today's costs.
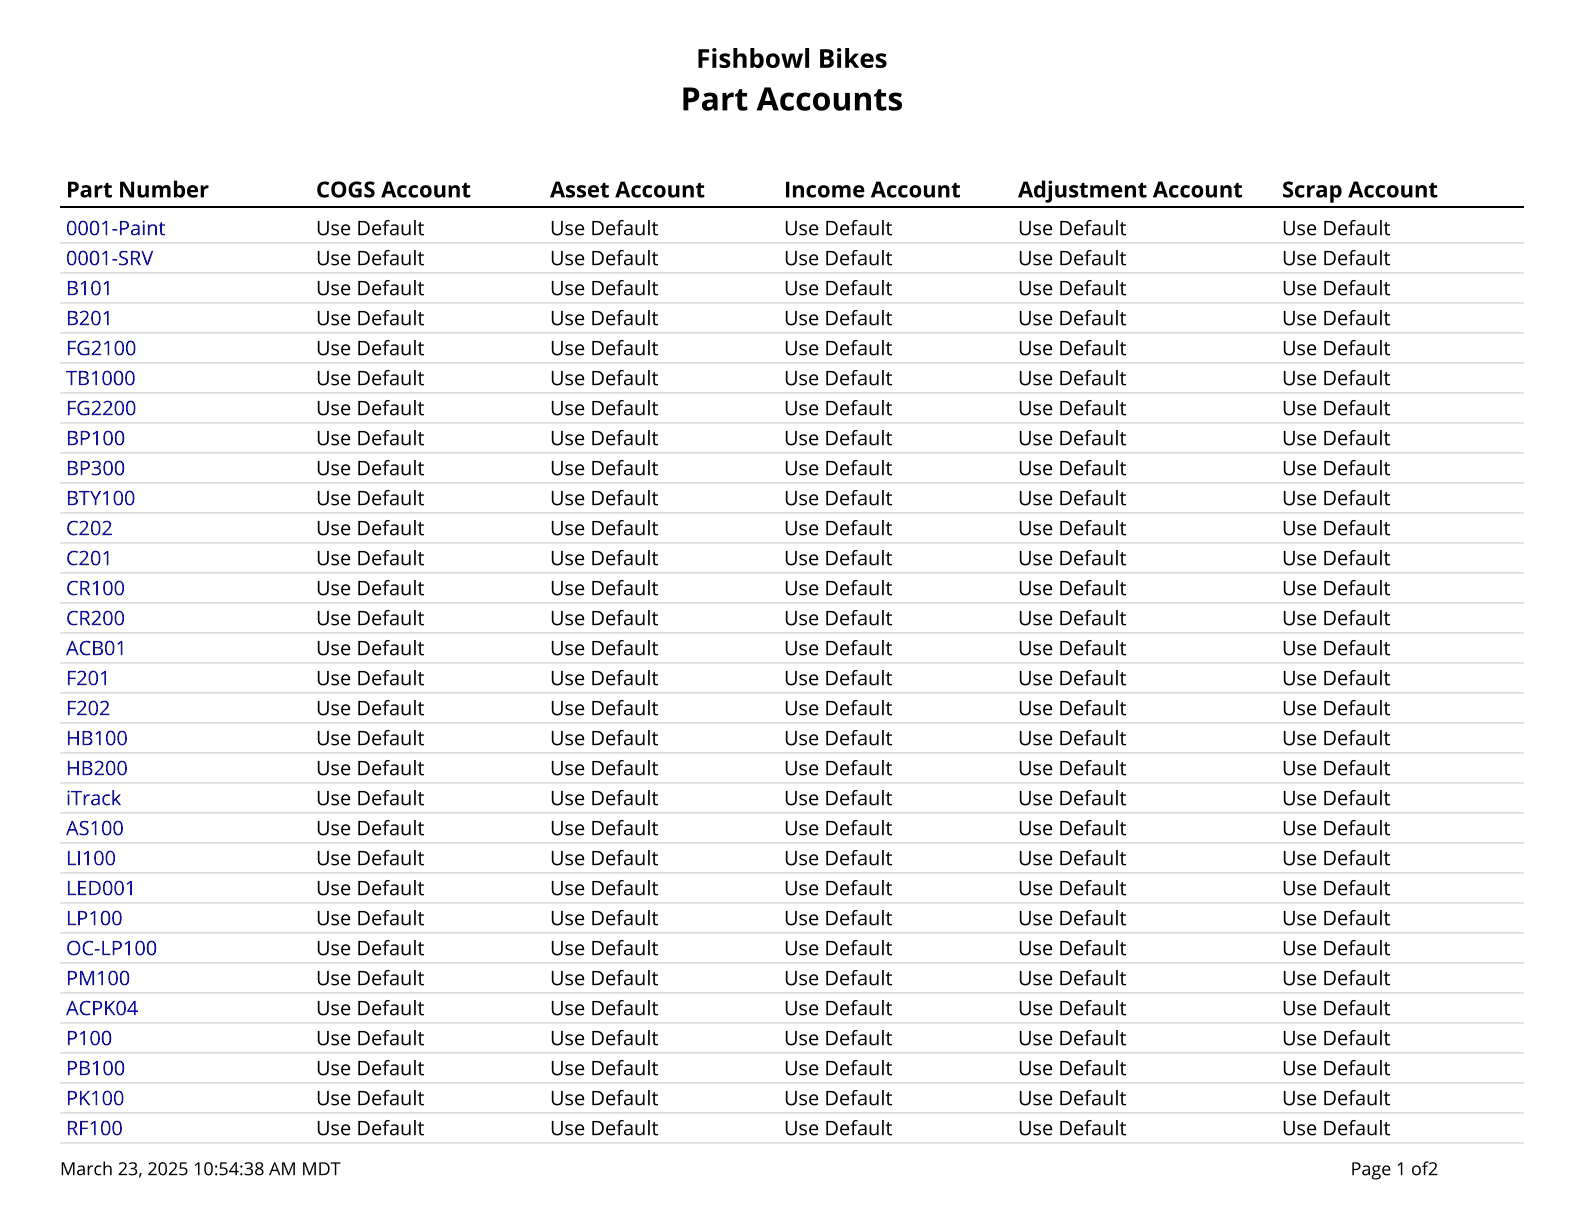
Part Accounts - Prints a list of parts and their associated accounts if they have been assigned.
Part Activity Report - Shows the activity history for a part or all parts. Note: UOM changes only show correctly when all Location Groups are selected.

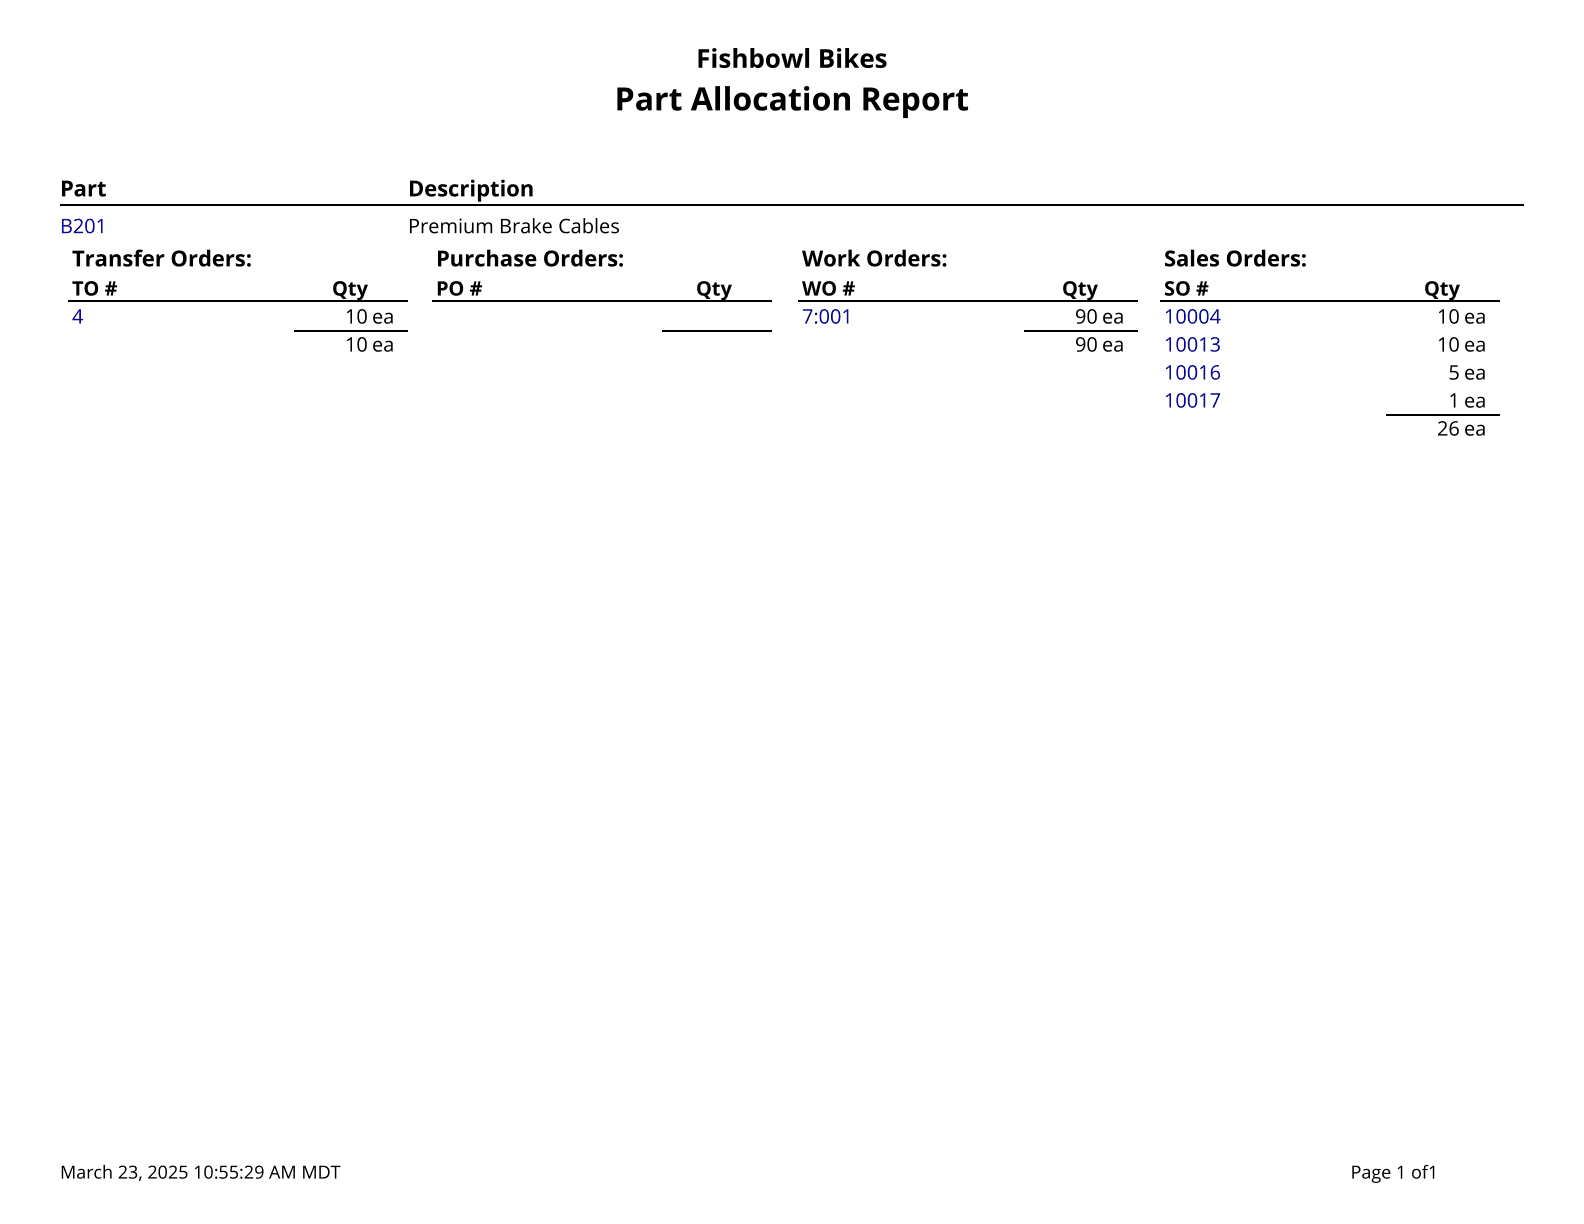
Part Allocated - Parts allocated to sales orders, work orders, purchase orders, and transfer orders.
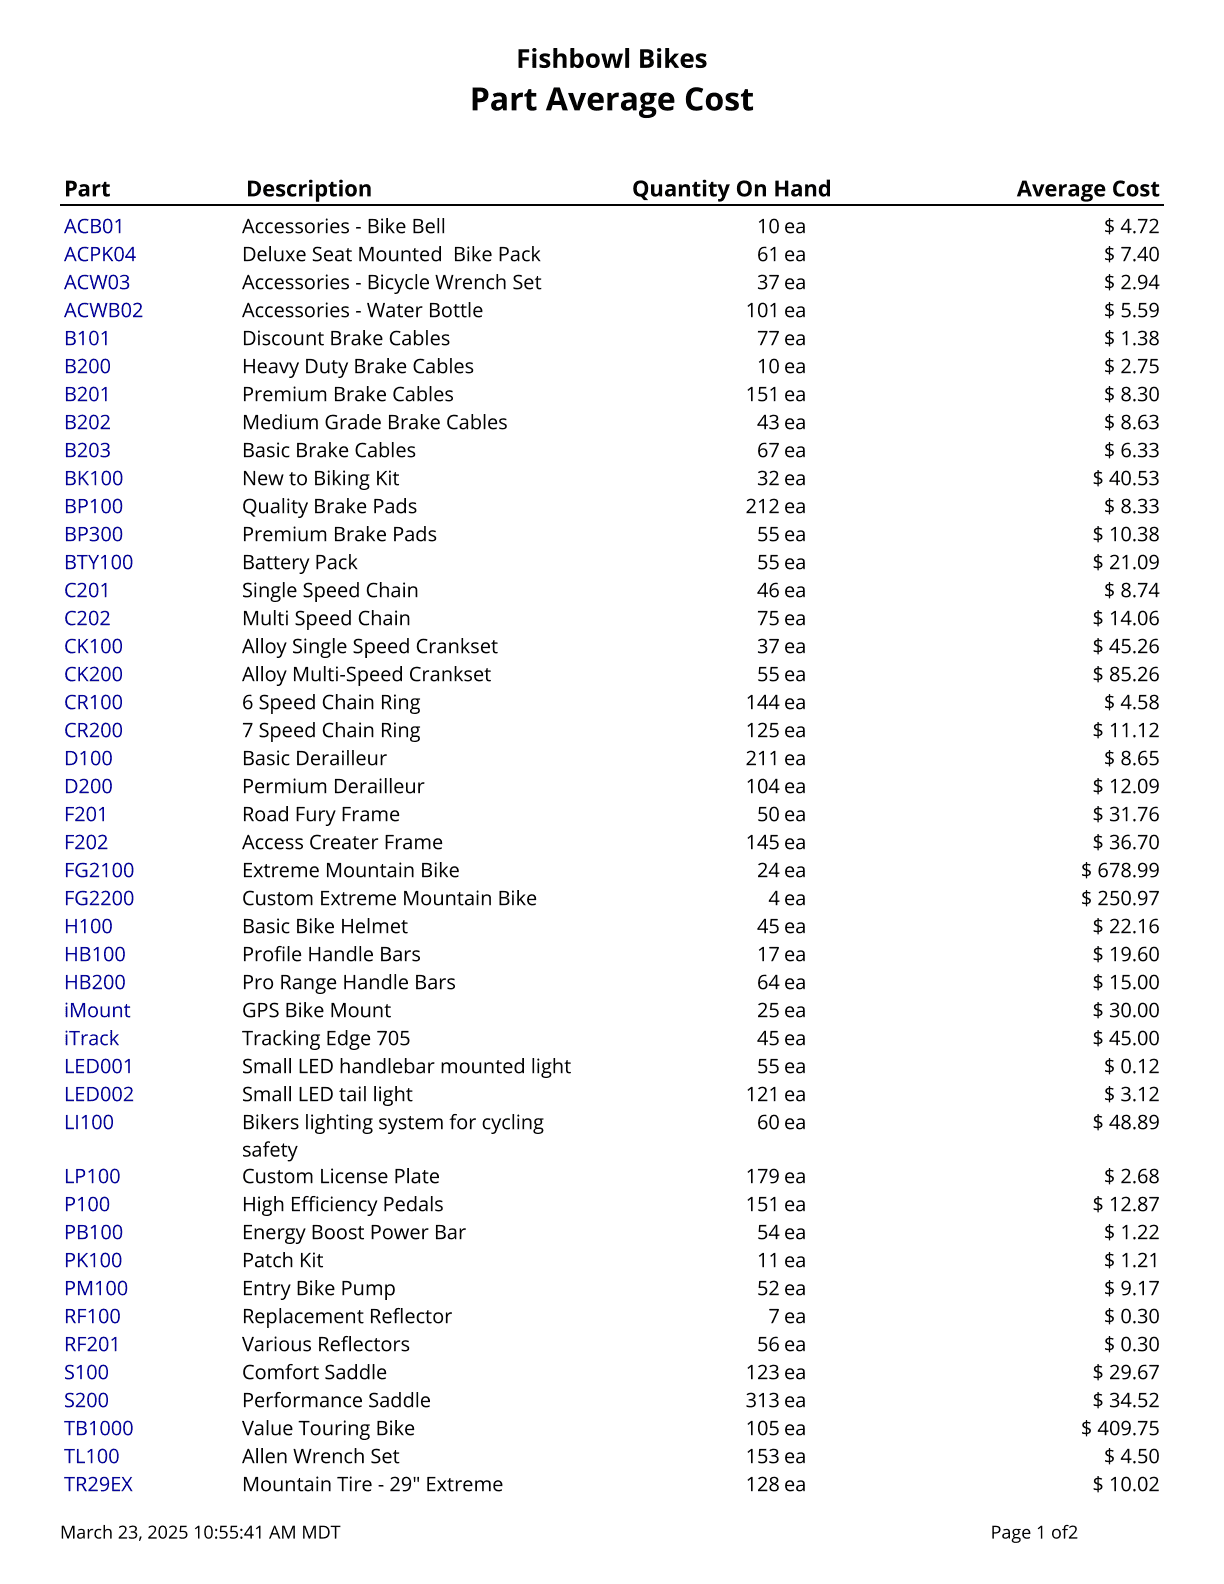
Part Average Cost - List all parts and their Average Cost.
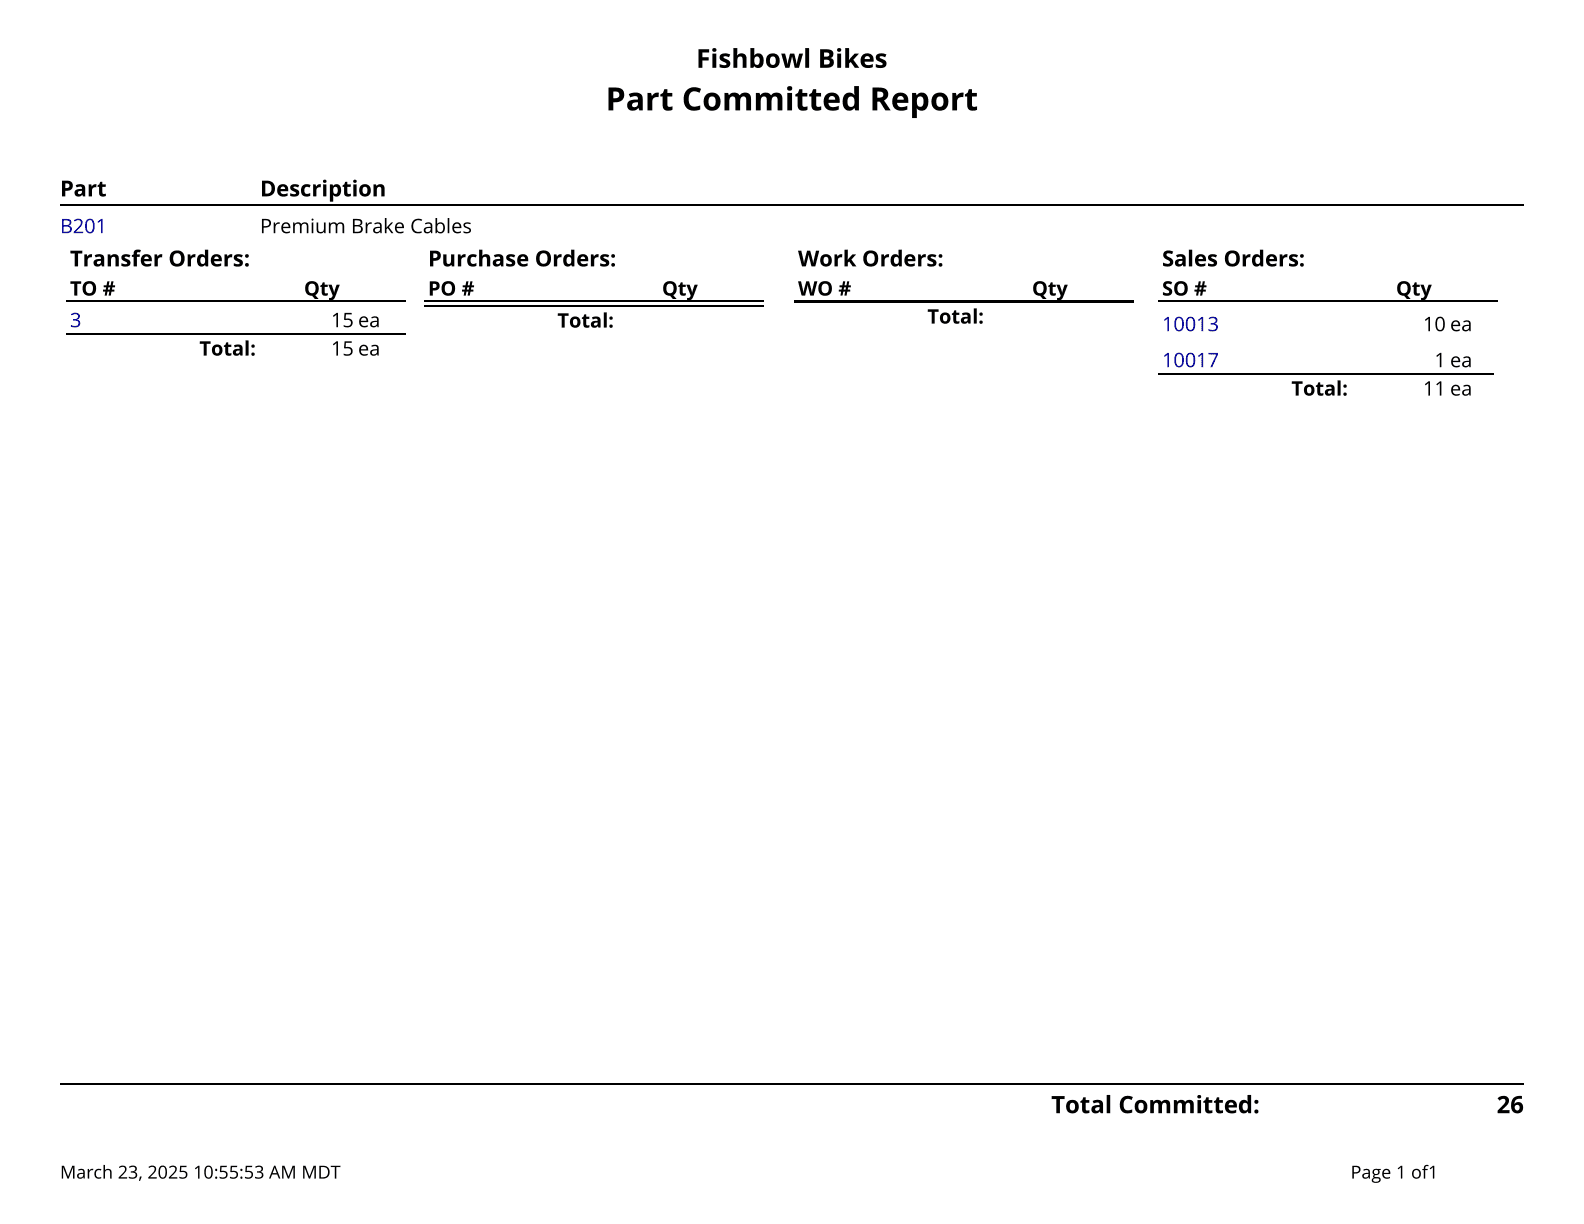
Part Committed Report - Shows where parts are committed.
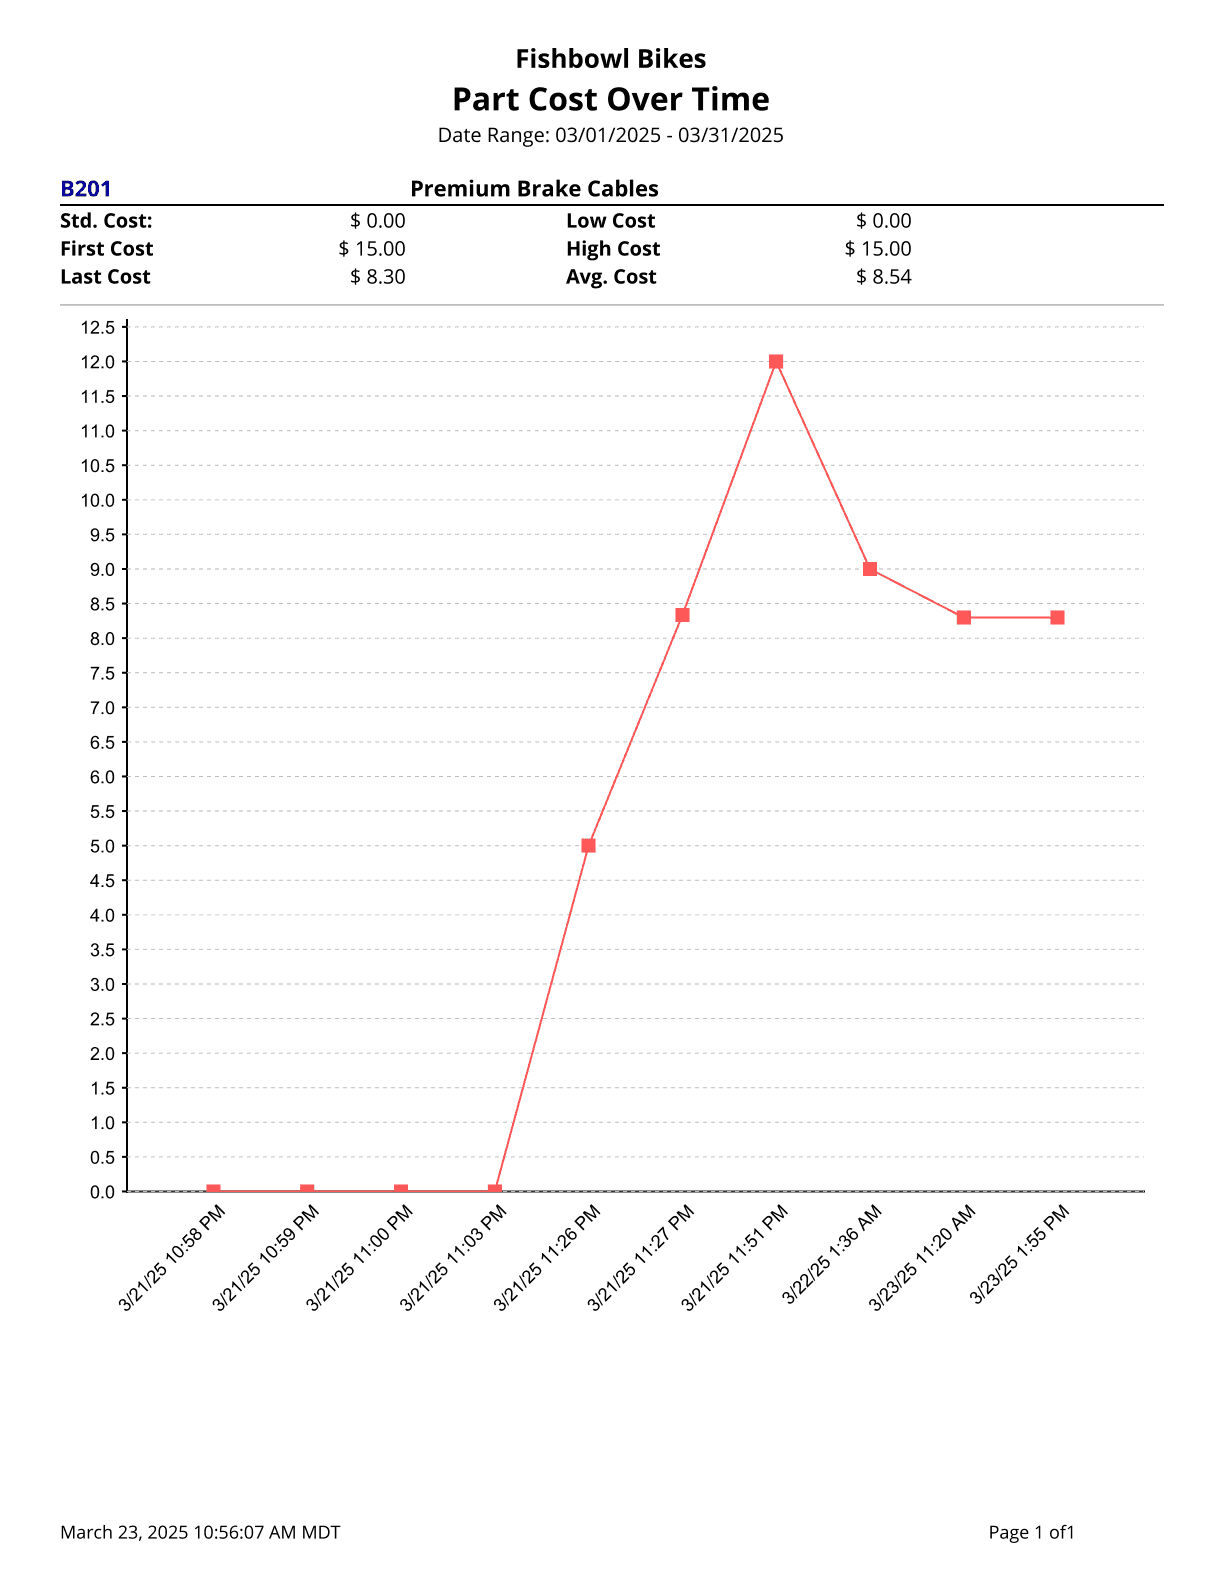
Part Cost Over Time - Lists all parts and their Costs. The Average cost is calculated over the specified date range.
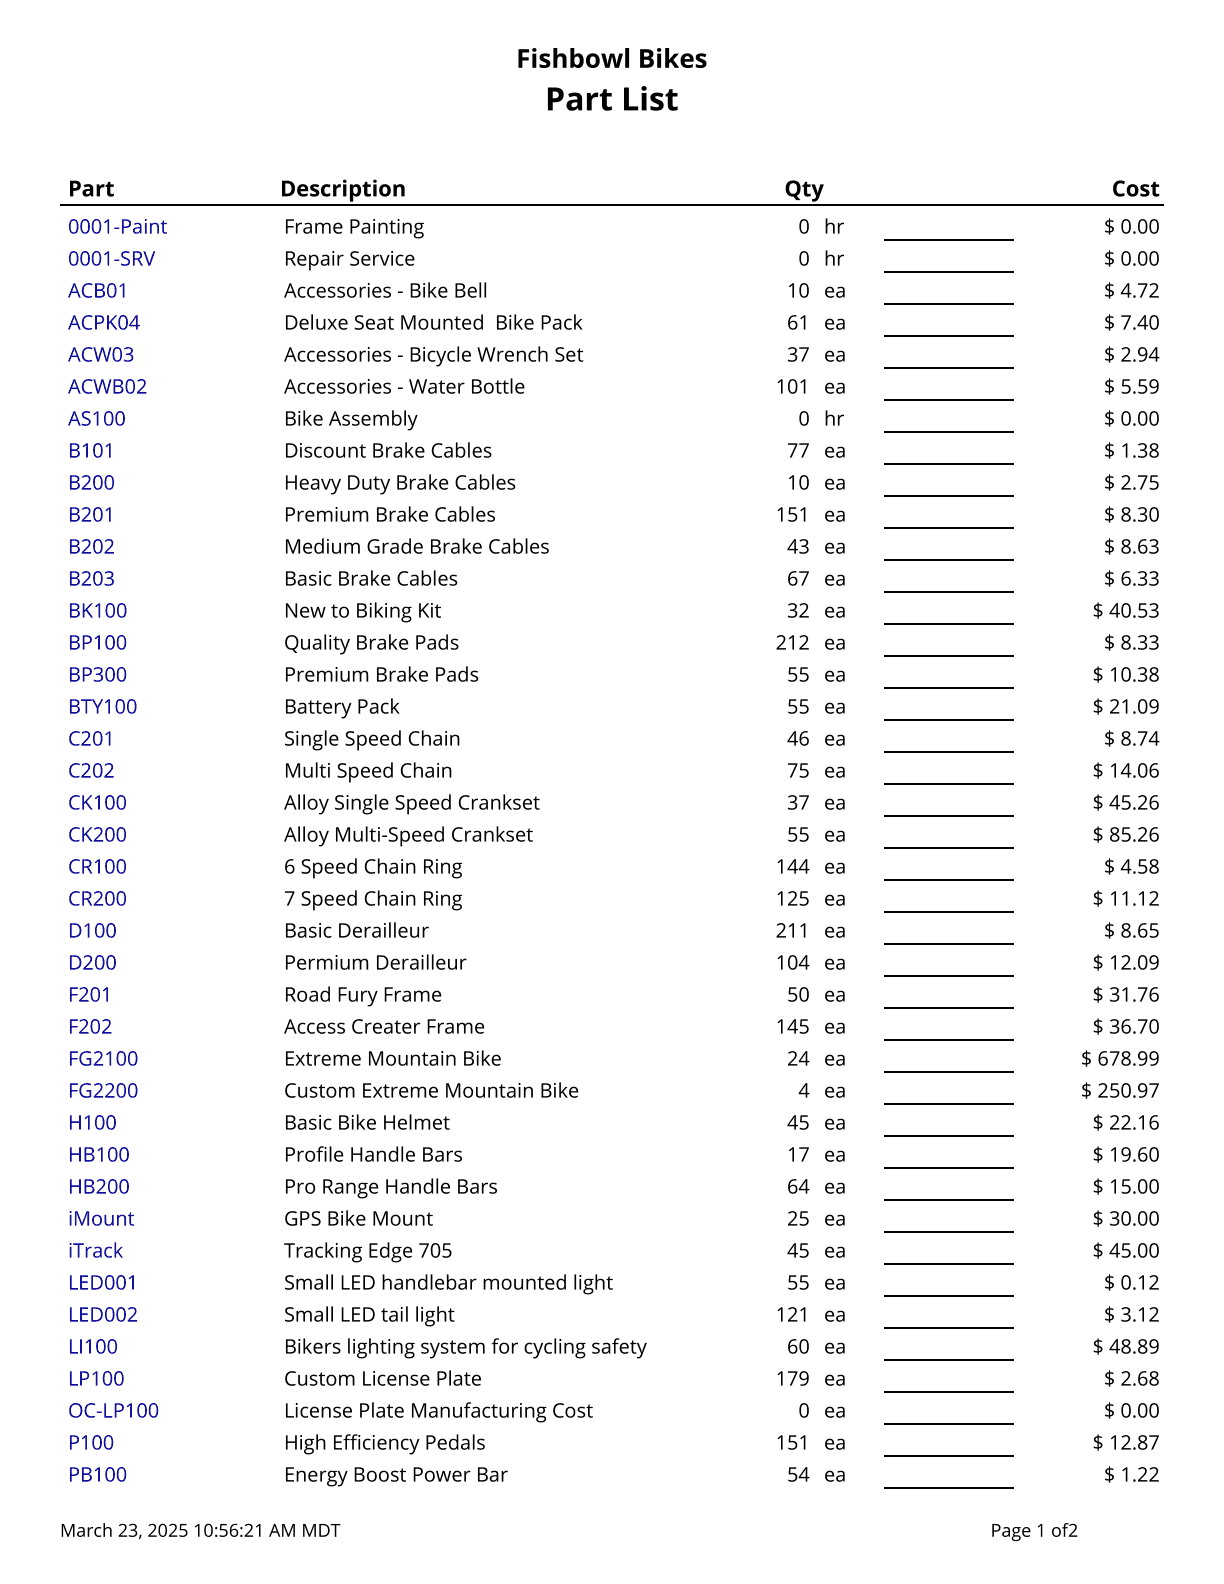
Part List - Part list. Use % for a wildcard search. Cost values are based on today's costs.
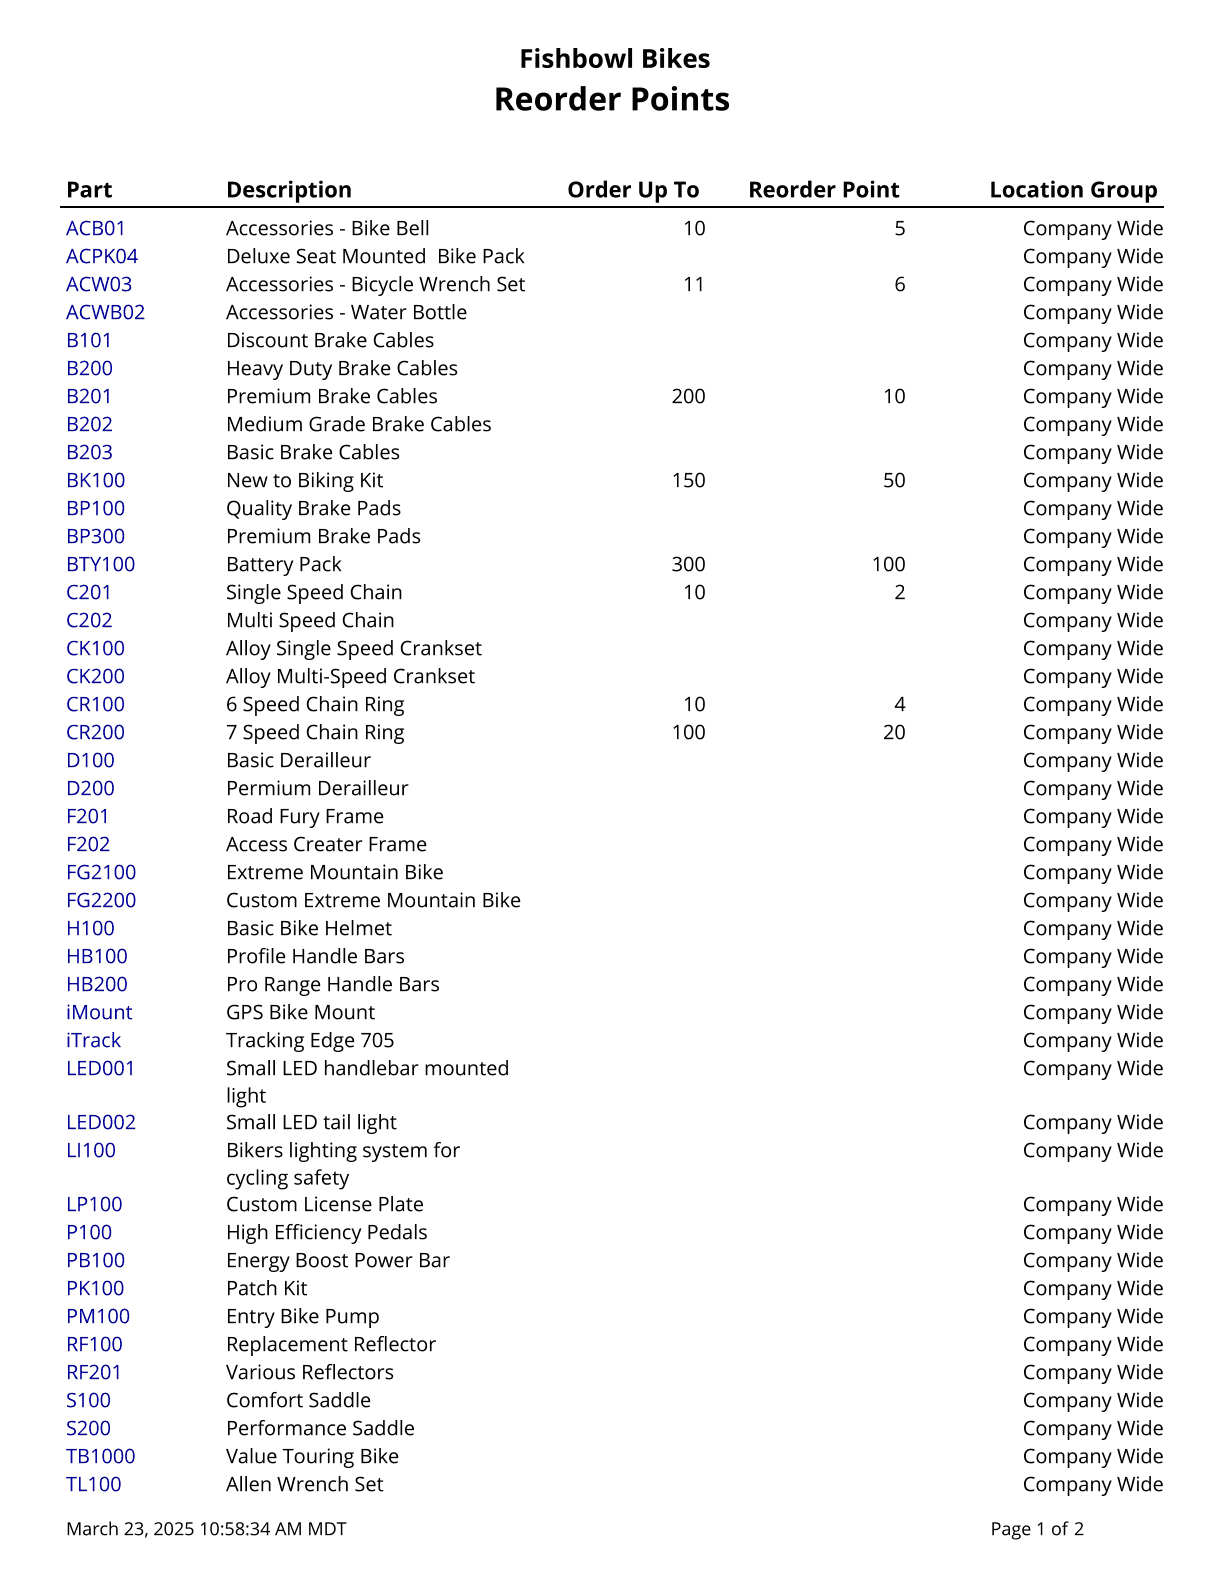
Reorder Points - Shows Reorder Points by Location Group or Company Wide.
|
| Picking
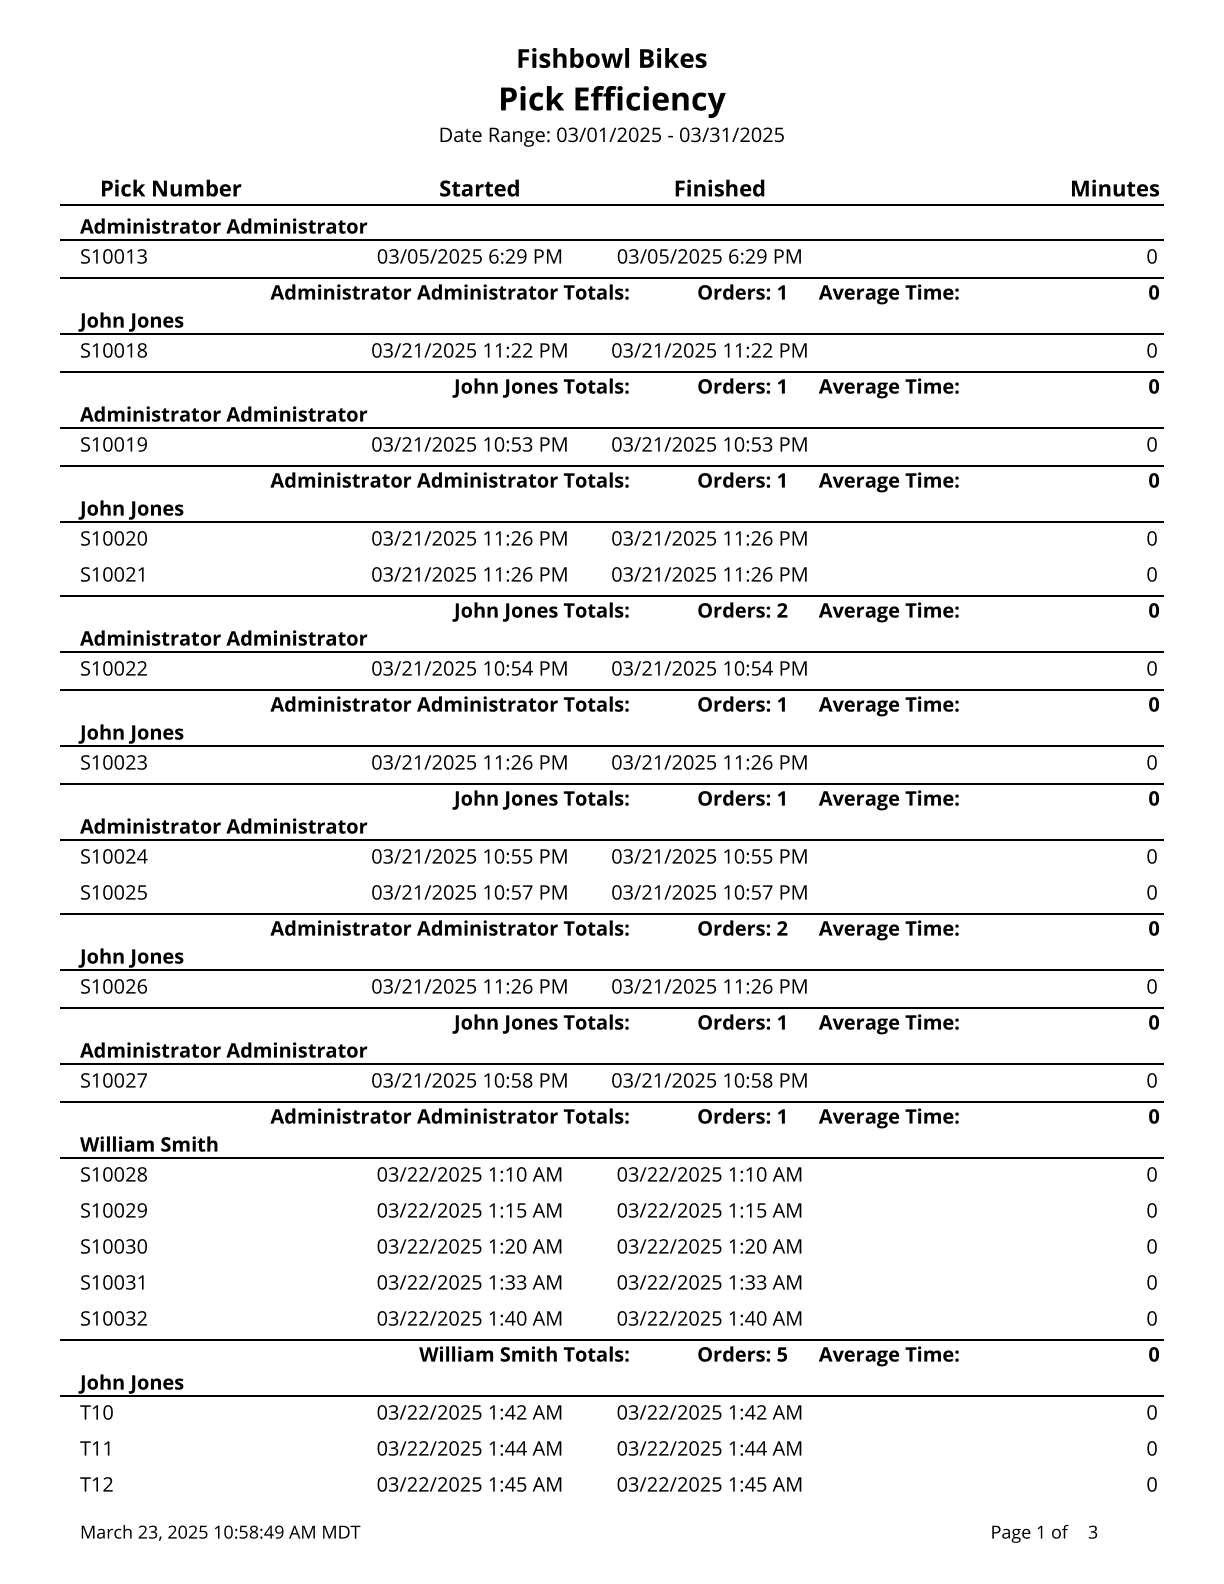
Pick Efficiency - Displays the efficiency of each pick order, grouped by user.
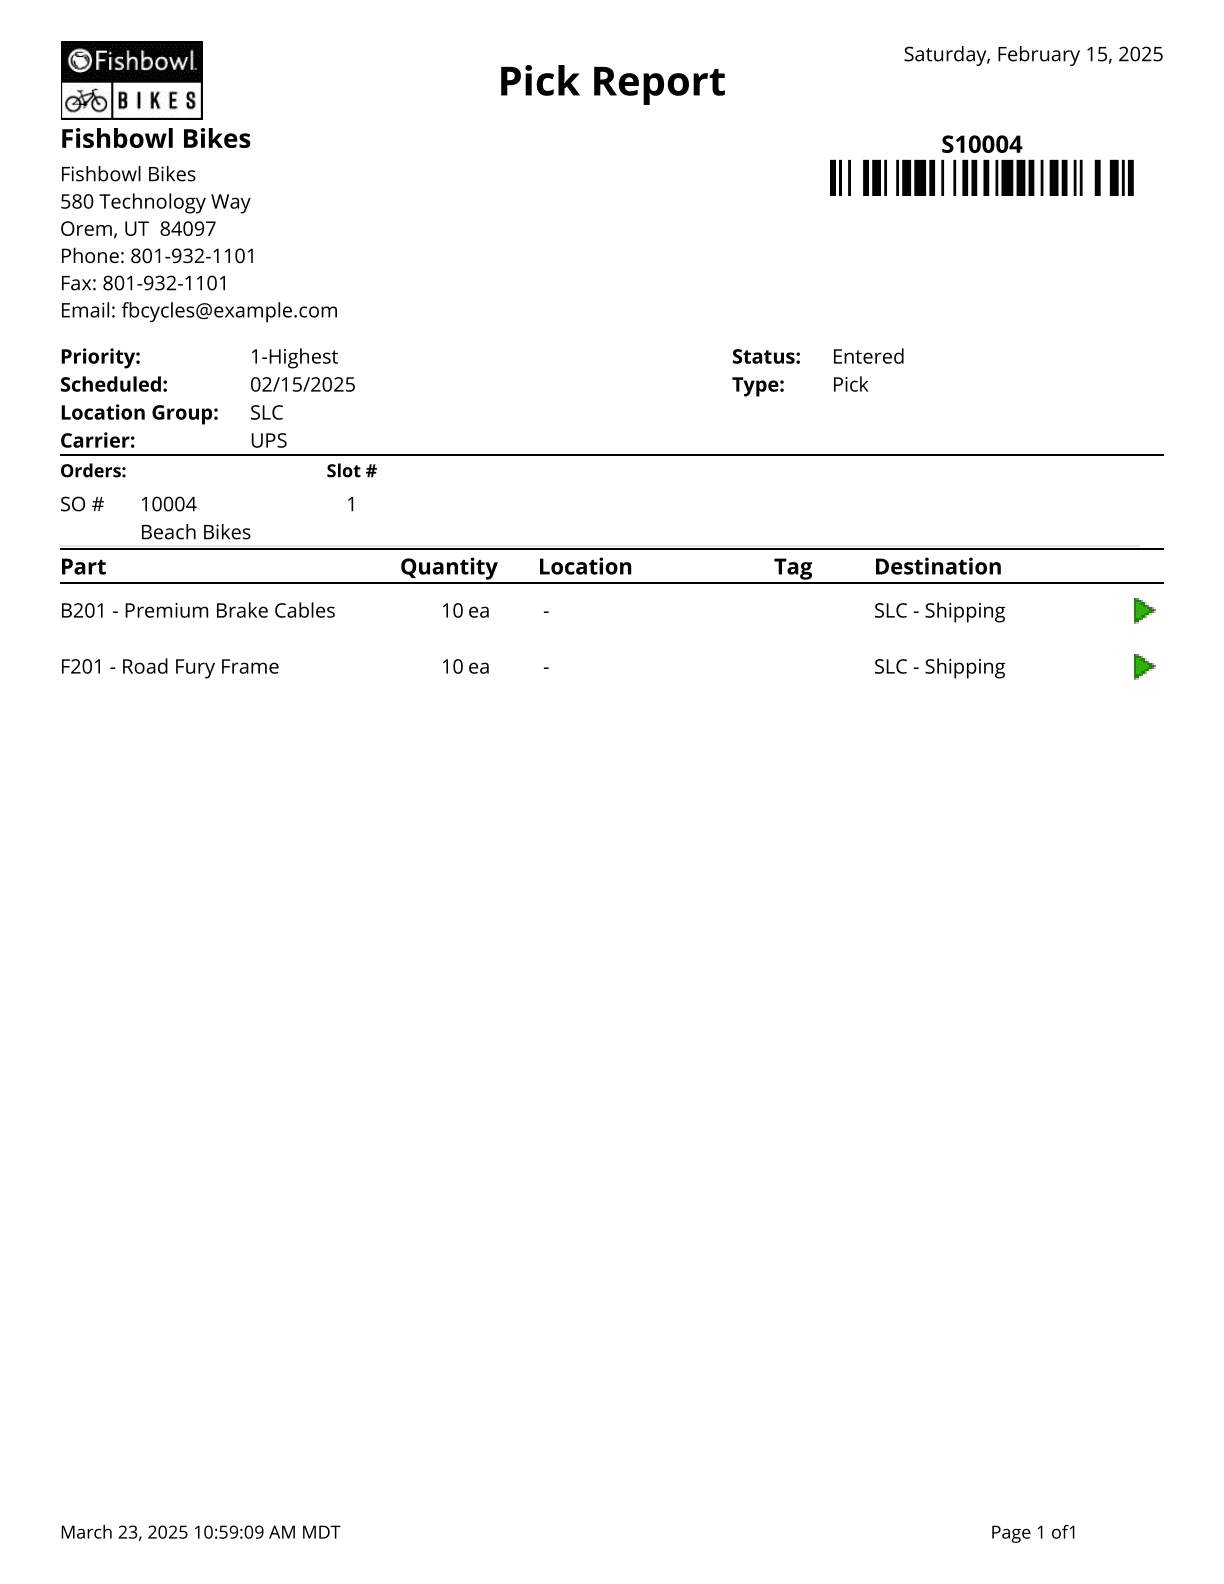
Pick Report - A complete list of ALL items on the Pick and their status.
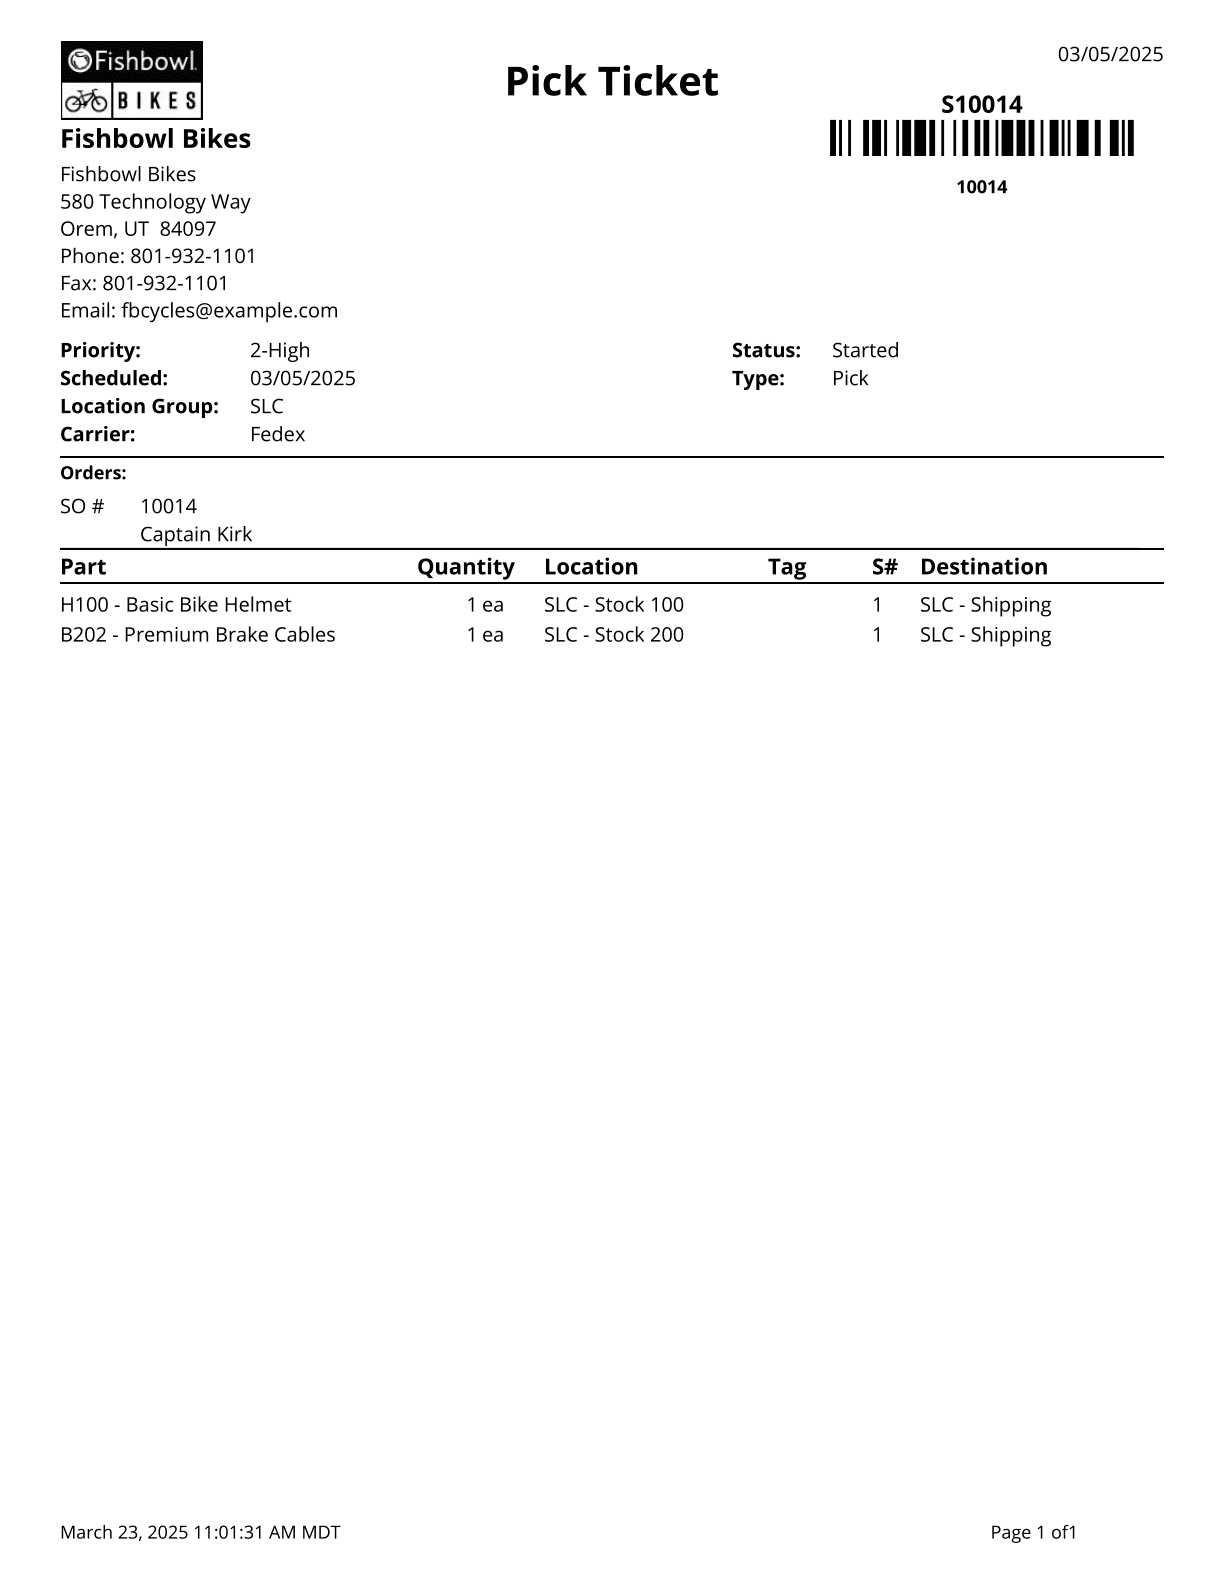
Pick Ticket - A list of Parts to Pick, where to get them, and where to put them after picking.
|
| Product
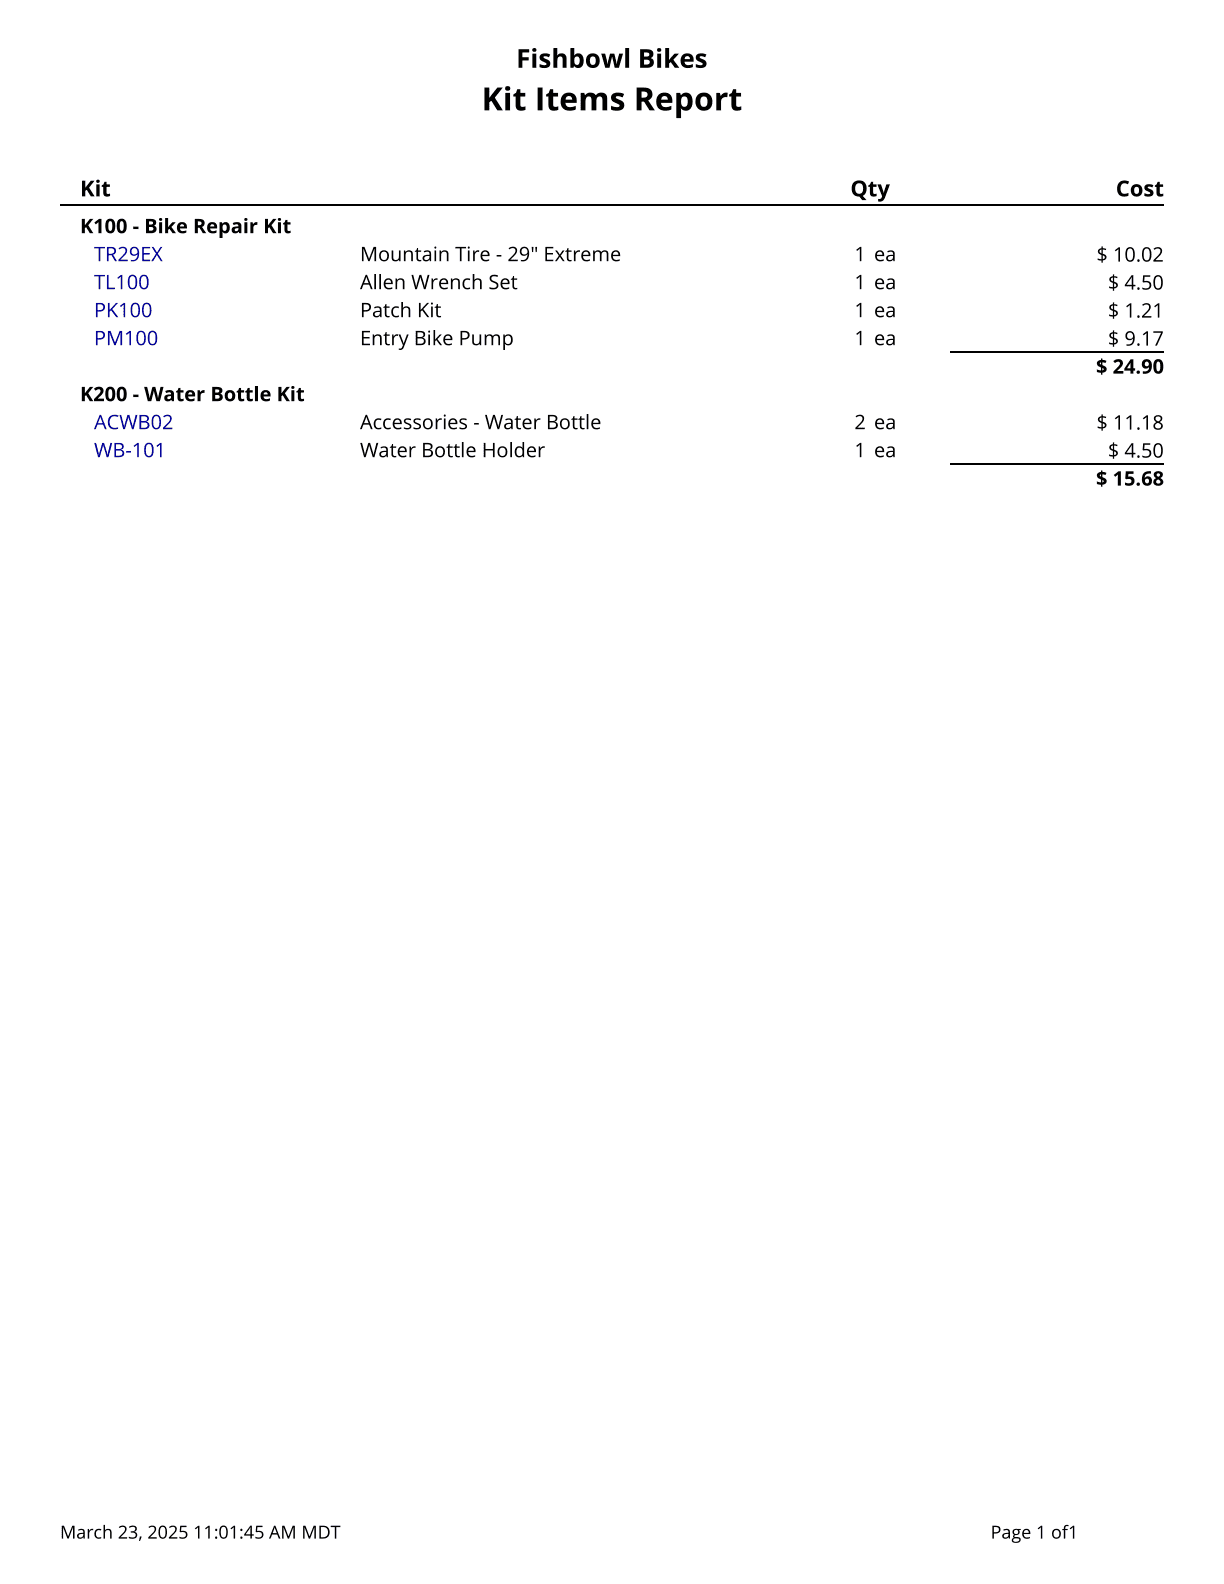
Kit Report - Displays list of kits and items within. Cost values are based on today's costs. Starred (*) items are the default of an optional or variable-optional item. Items that are not default do not display quantity or cost.
Product Catalog - Prints a list of products with pictures and barcodes.

Product Catalog V2 - Prints a list of products with pictures and barcodes.

Product Price List - Product Price List that pulls directly from the price listed on the product. Pricing rules are not applied on this report. Use % for a wildcard search.

|
| Purchase Order
Advanced Purchasing By Sales Order - Looks at the fulfillment date on an SO and then looks at the lead time on the individual BOM items. Based on the fulfillment date of the SO and the lead time of the item, the report shows you what day to place your PO.

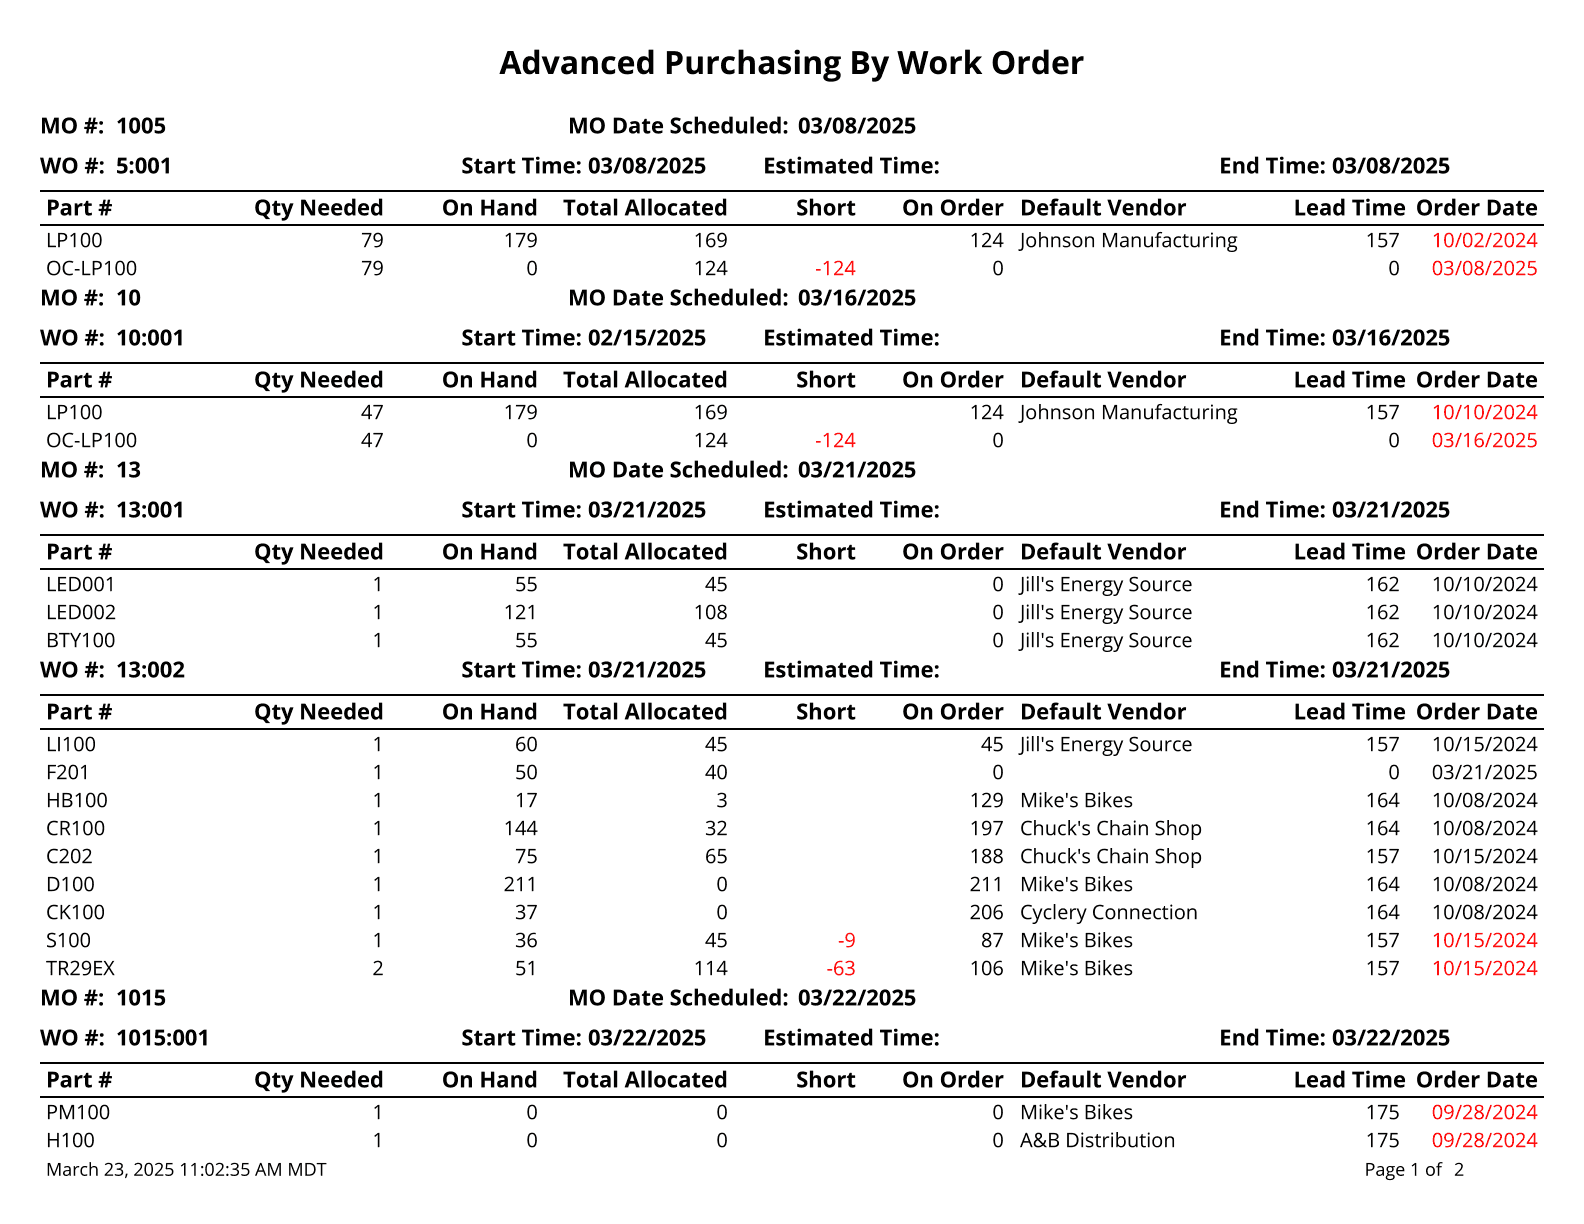
Advanced Purchasing By Work Order - Looks at the fulfillment date on a WO and then looks at the lead time on the individual BOM items. Based on the fulfillment date of the WO and the lead time of the item, the report shows you what day to place your PO.
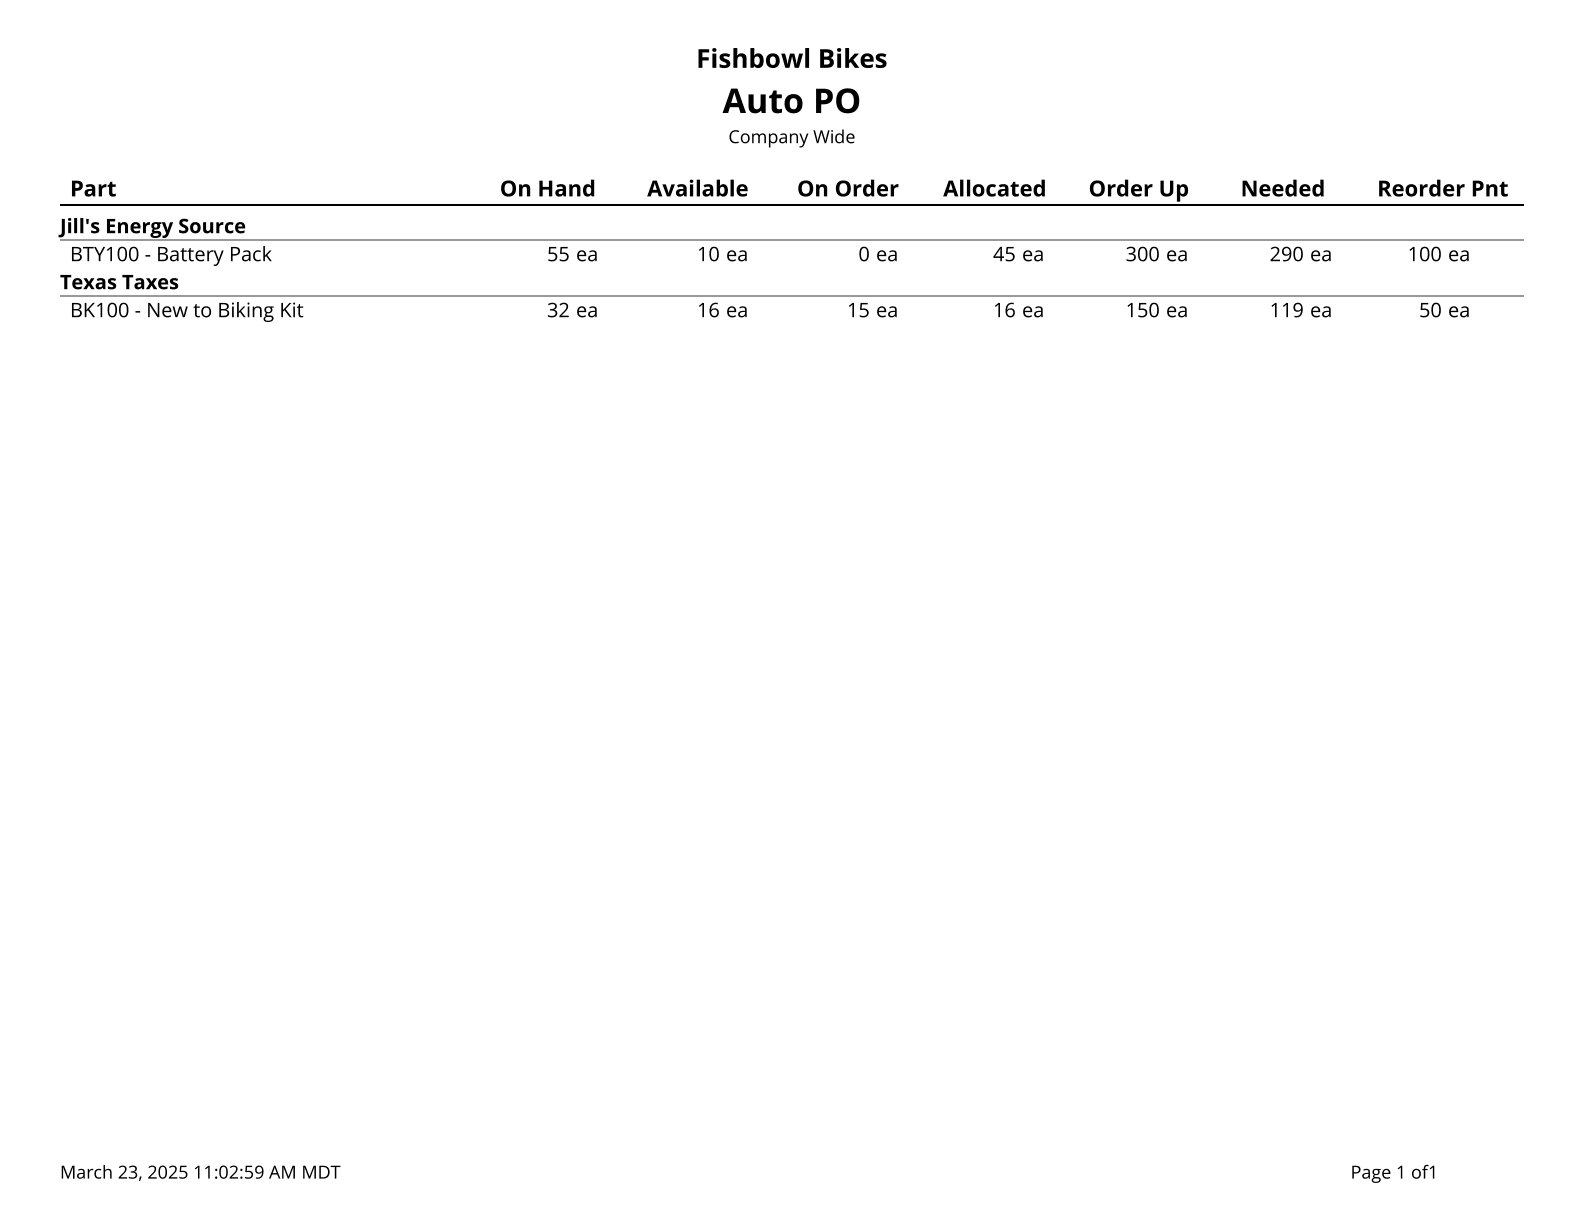
Auto PO - Prints a list of parts below reorder tolerance. This report runs the Auto-PO code and can take a few minutes to generate. Only includes parts without a default BOM or a BOM set to never auto-create.
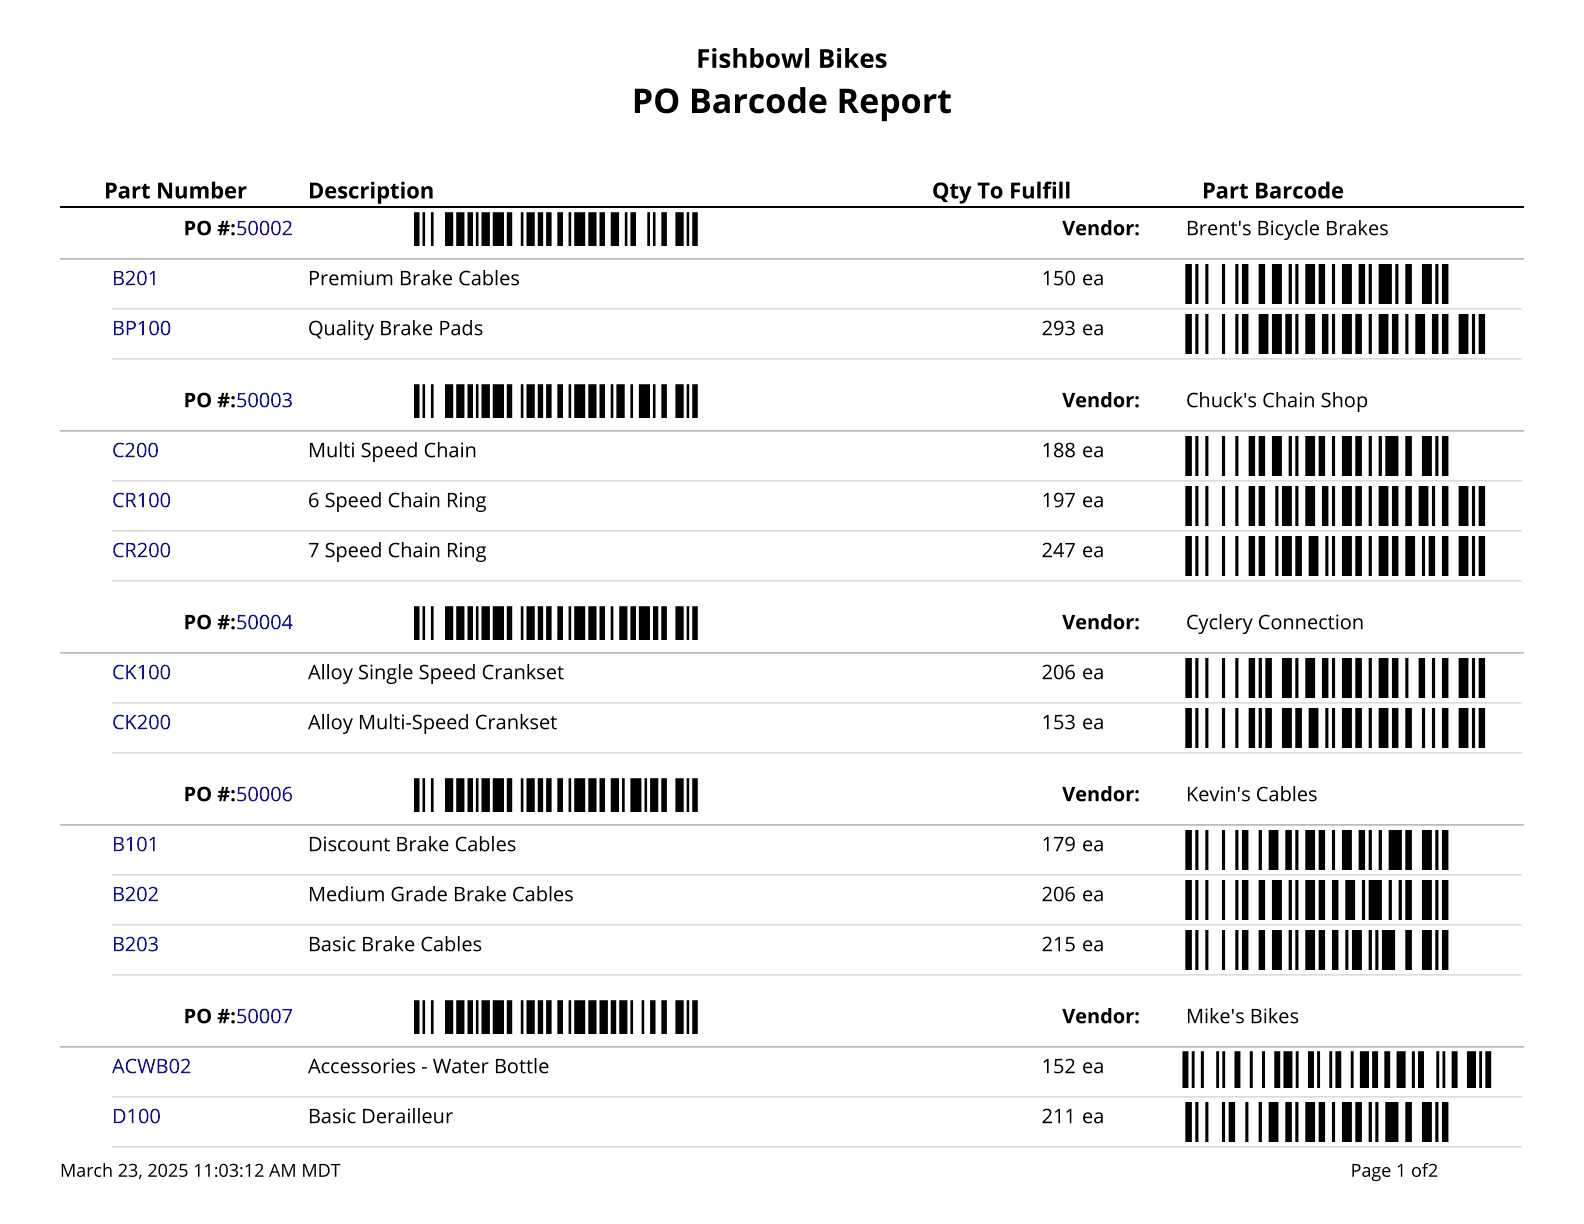
Purchase Order Barcode - Prints PO number and PO item barcodes.
Purchase Order Report - Purchase Order Details.
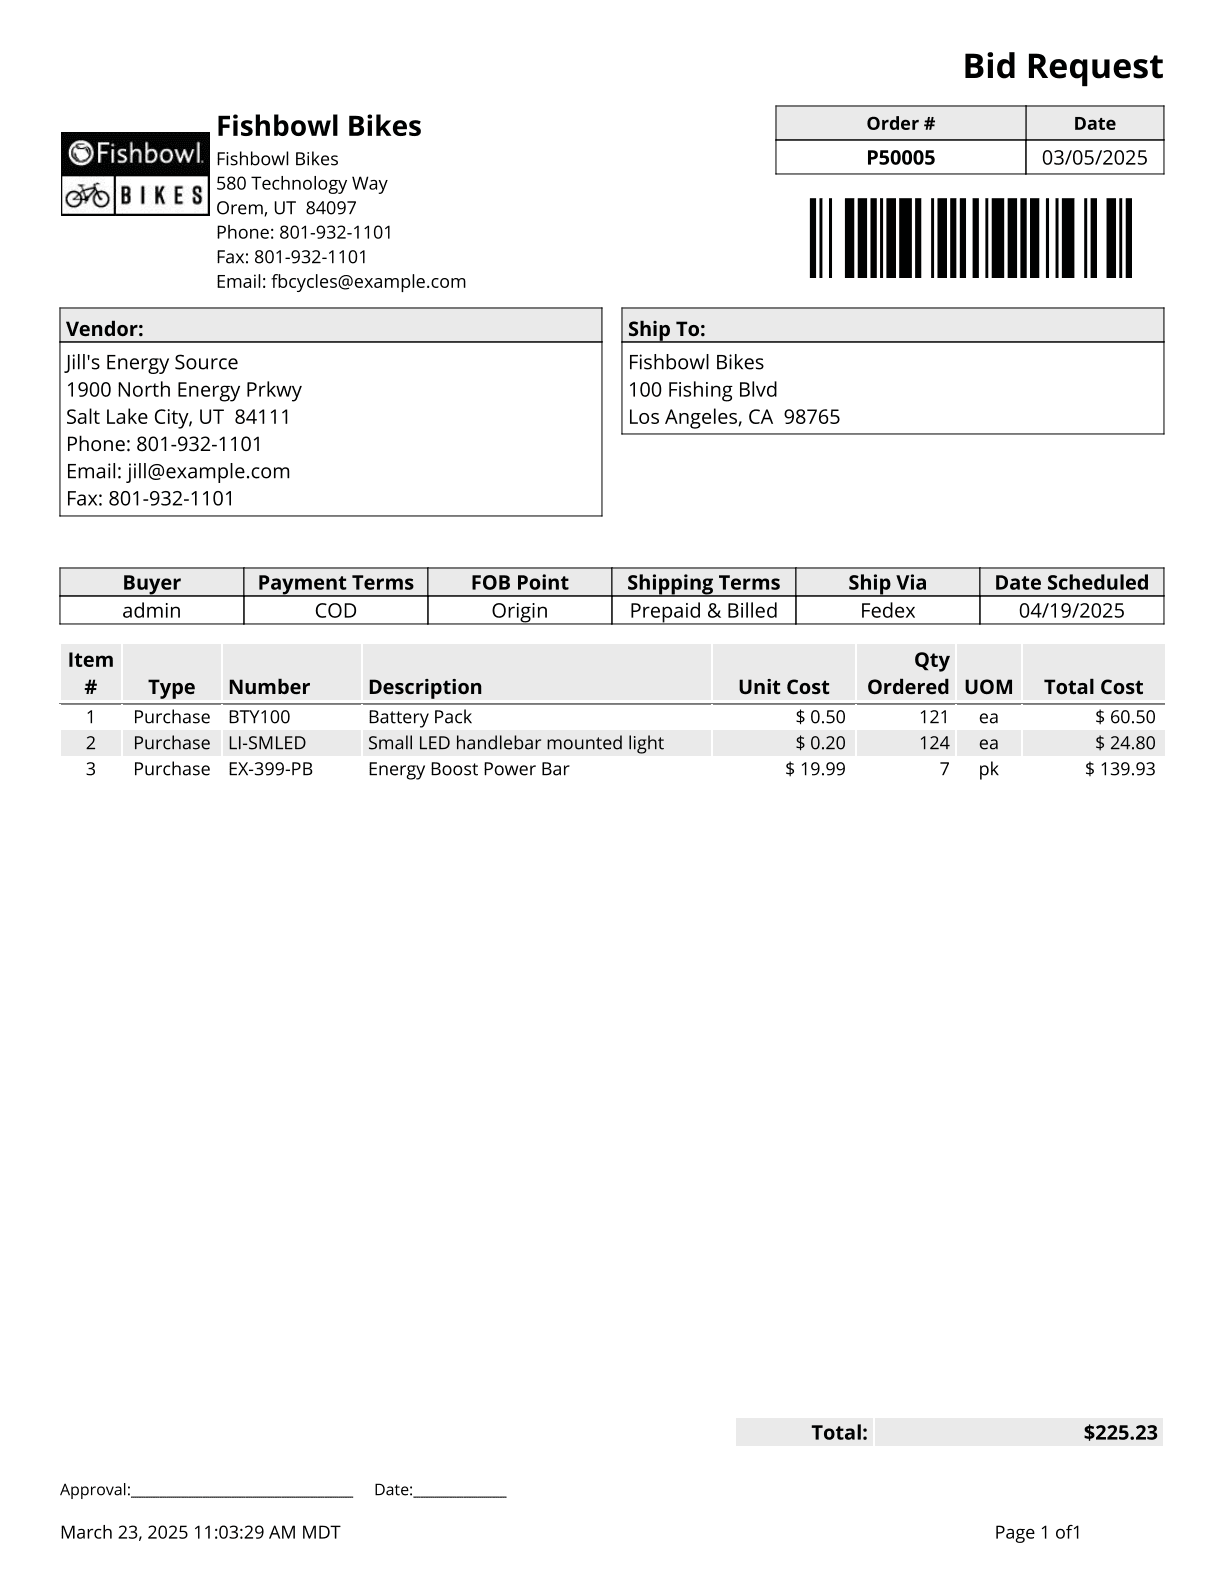
Purchase Order Summary - Lists parts on outstanding purchase orders by location group and either part number or purchase order number.
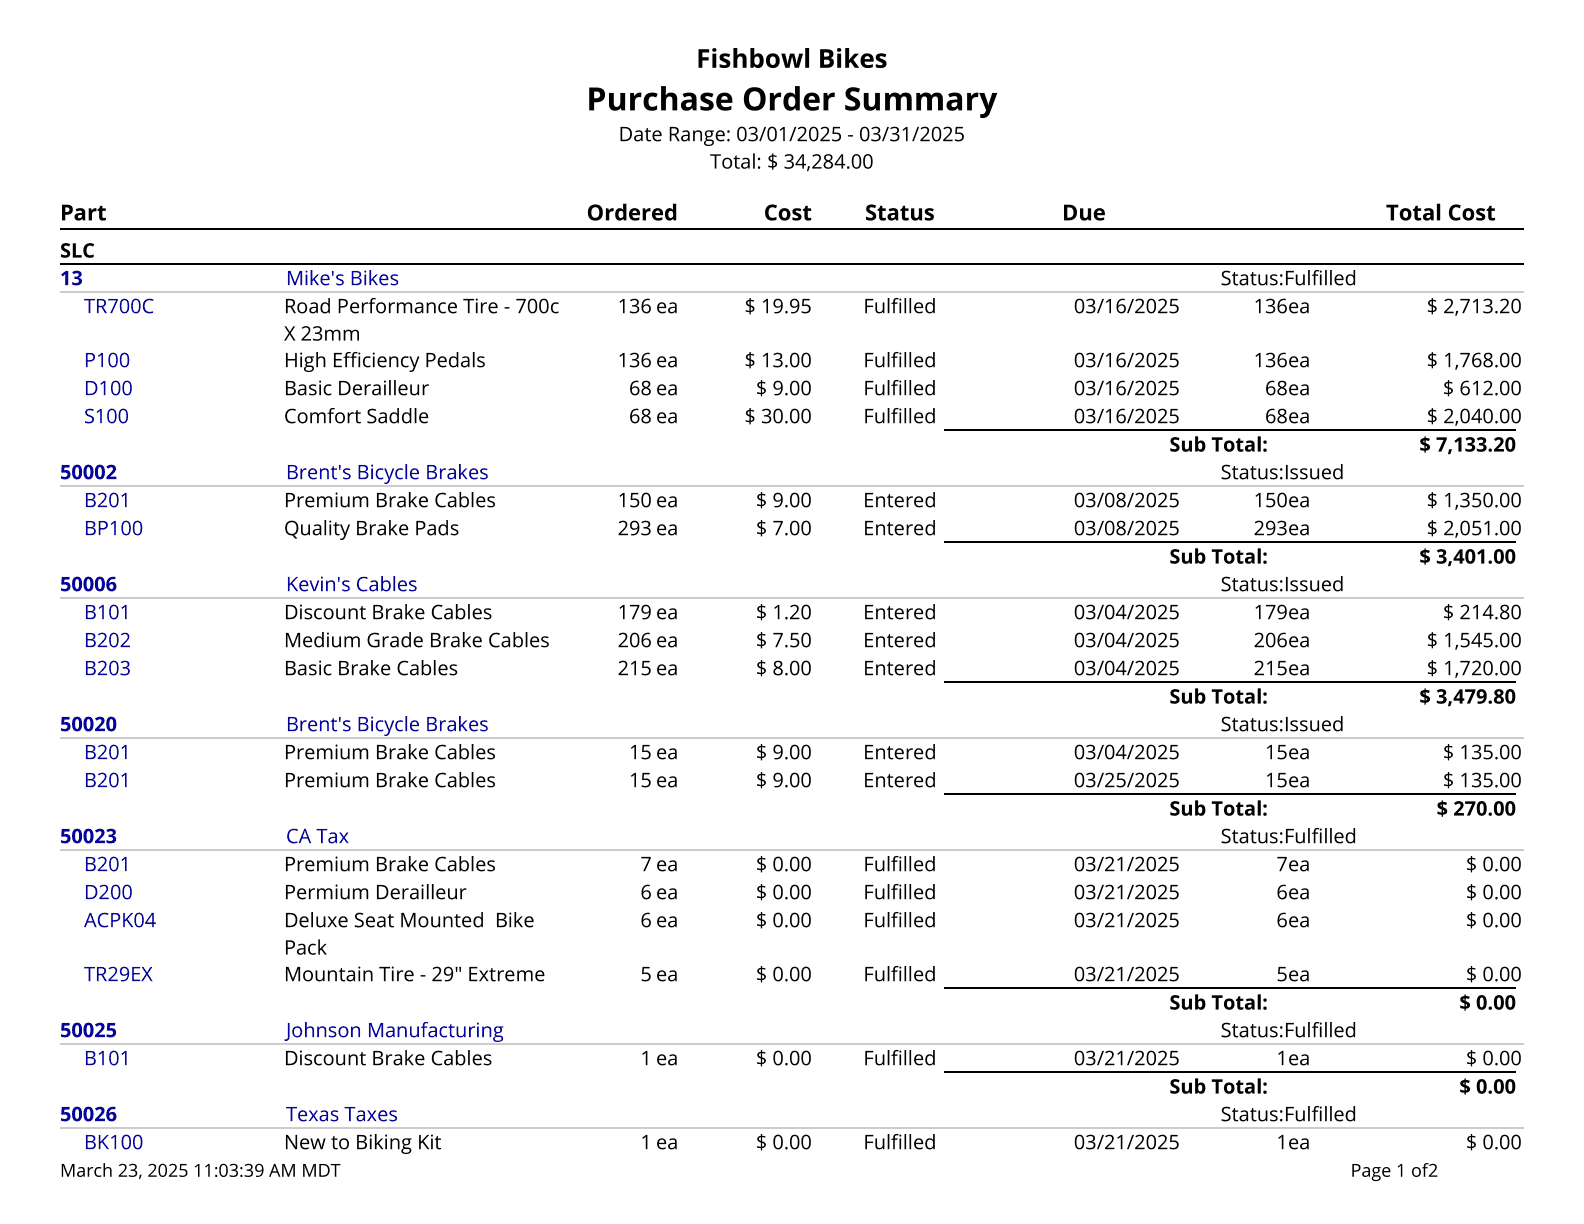
Purchase Order Summary Export - This report is formatted for exporting and displays a summary of purchase orders issued during the time window given.

|
| Receiving
Receiving History - Prints a list of all receipts over a date range, filtered by location group, vendor, and/or part.

Receiving List - A list of Parts to be Received.

Receiving Summary - Shows an overview of orders that are in receiving and their status. It can show which orders have items that have been received but not reconciled which can help accountants.

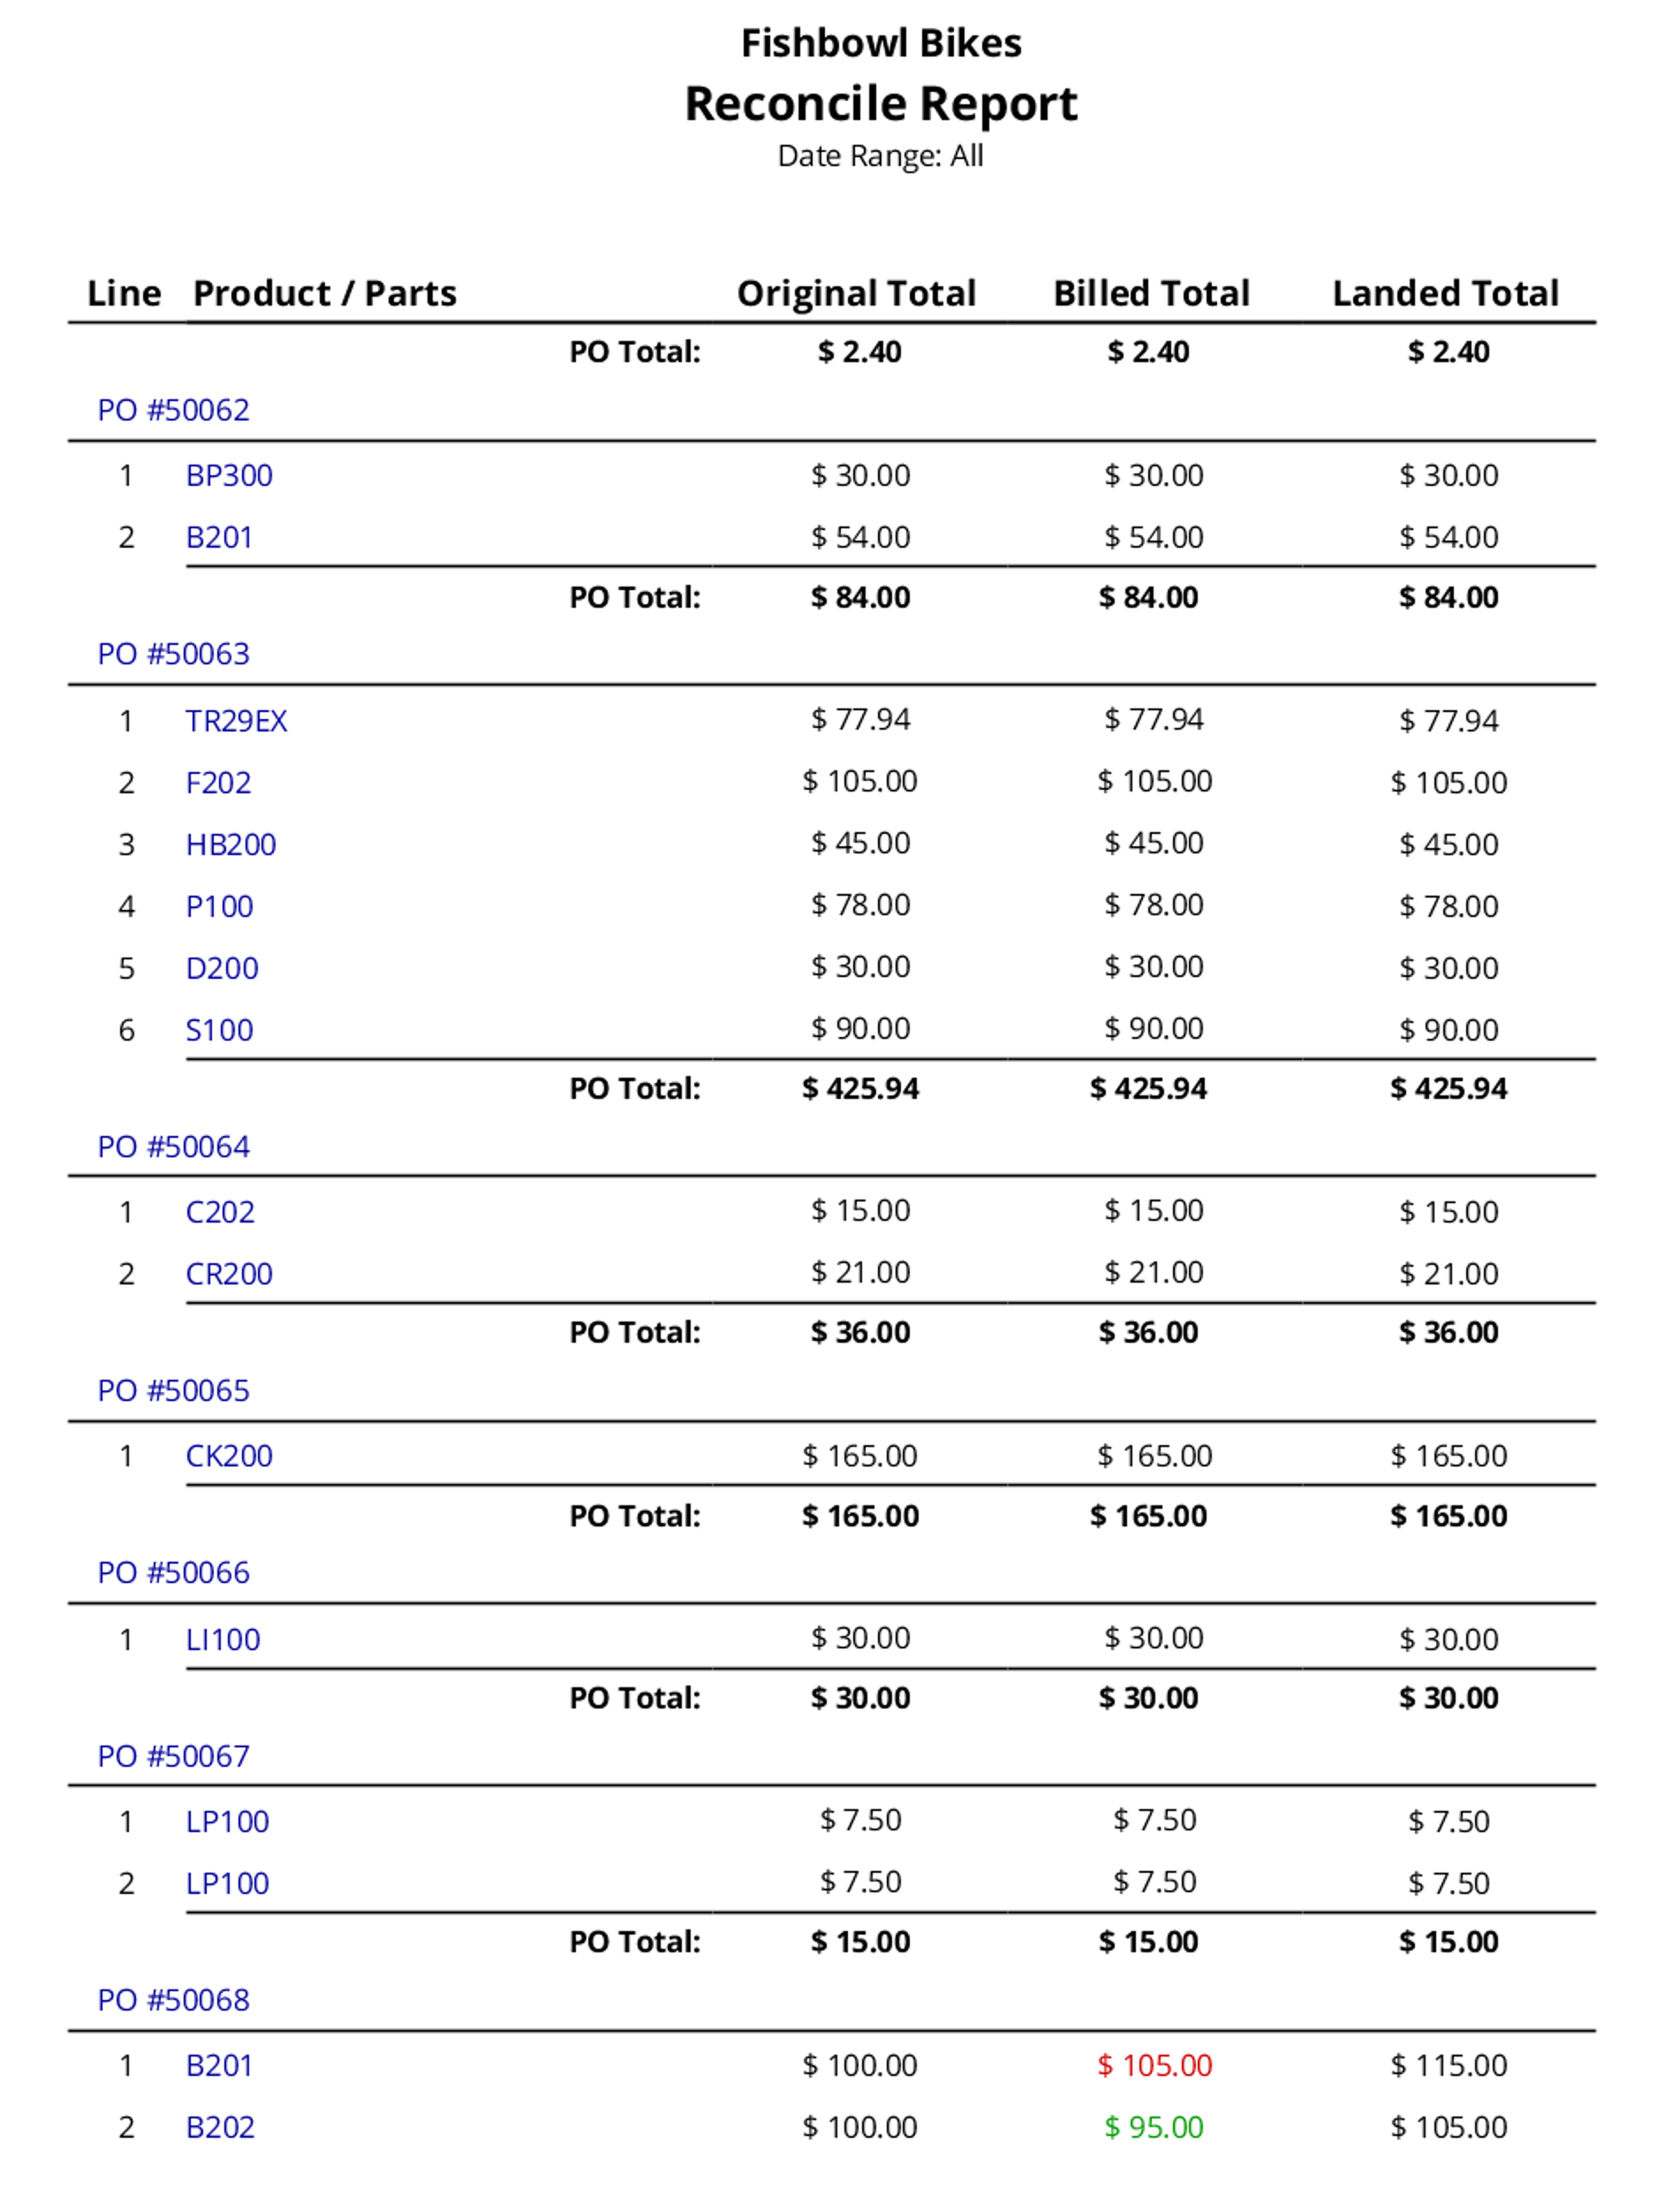
Reconcile Report - Shows the detail of PO exports to the accounting system.
|
| RMA
RMA Report - A list of Products being returned on a Return Merchandise Authorization ticket.
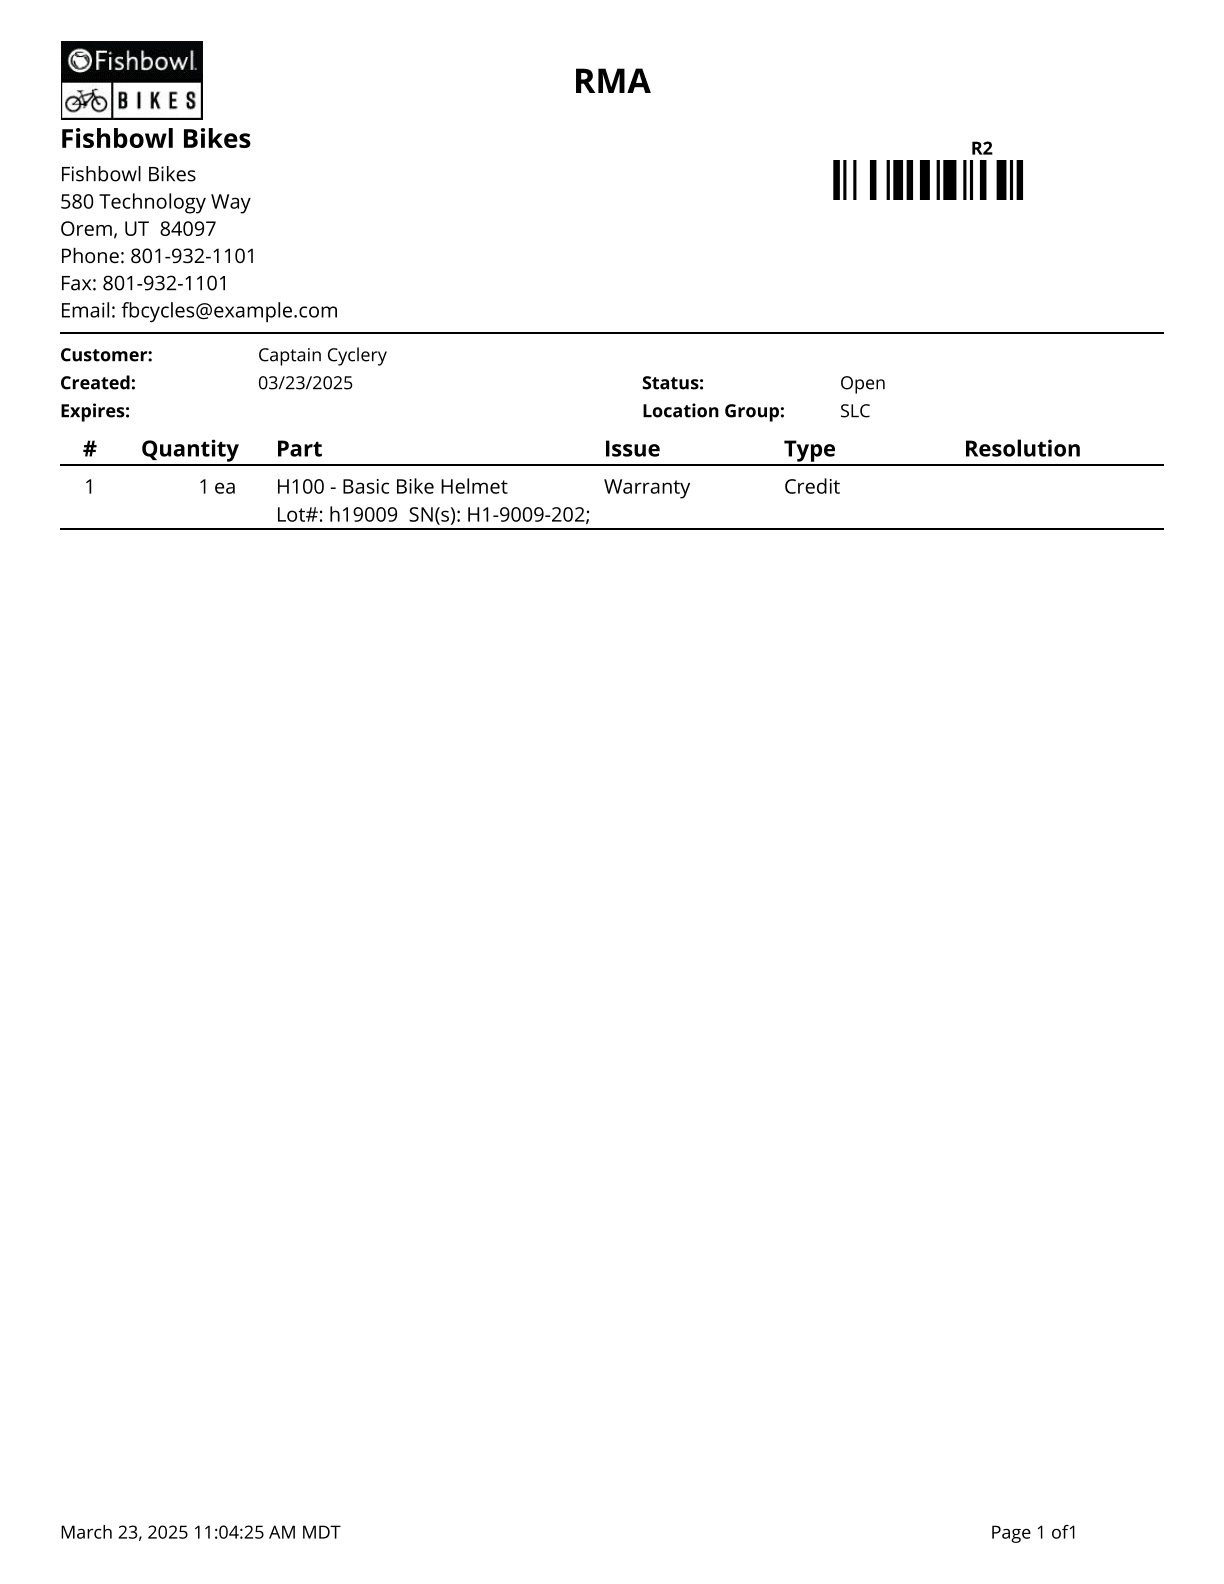
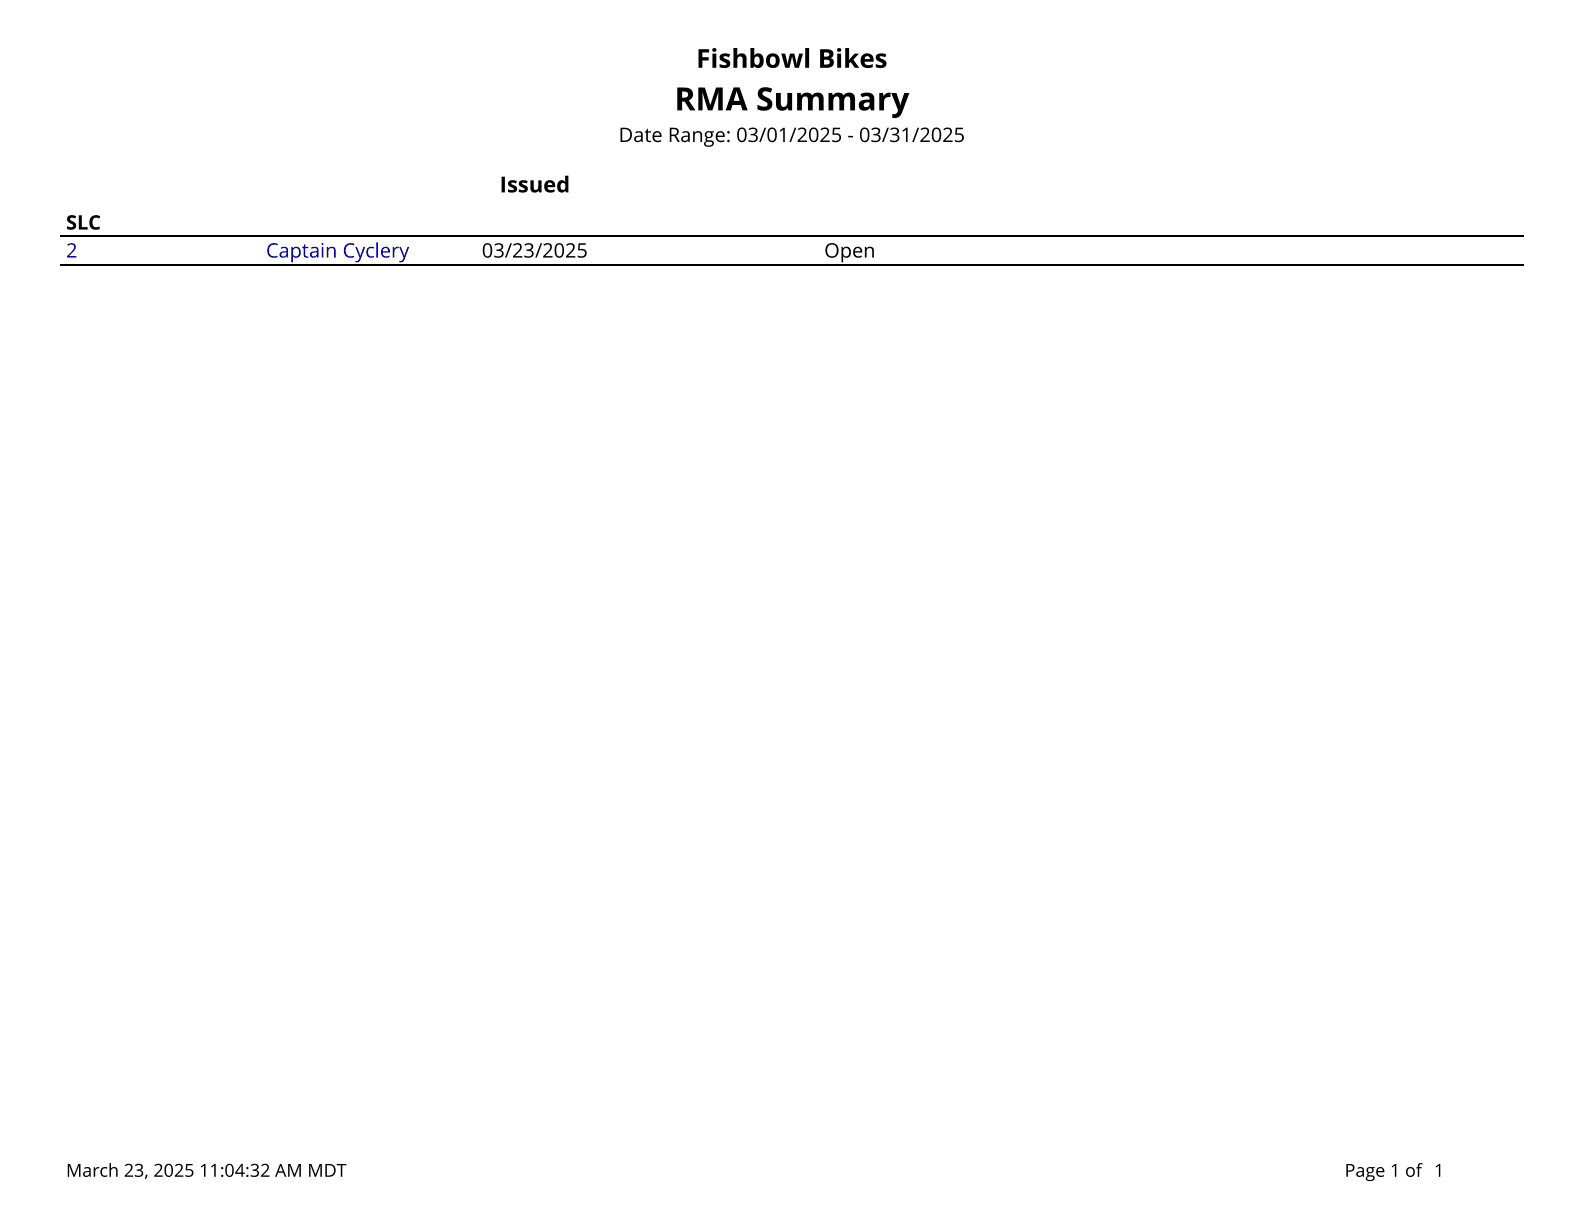
RMA Summary - Prints a summary of RMAs issued during the time window given; no taxes or shipping fees are included.
|
| Sales Order
Compare Sales By Month - Compares Gross Sales By Month.

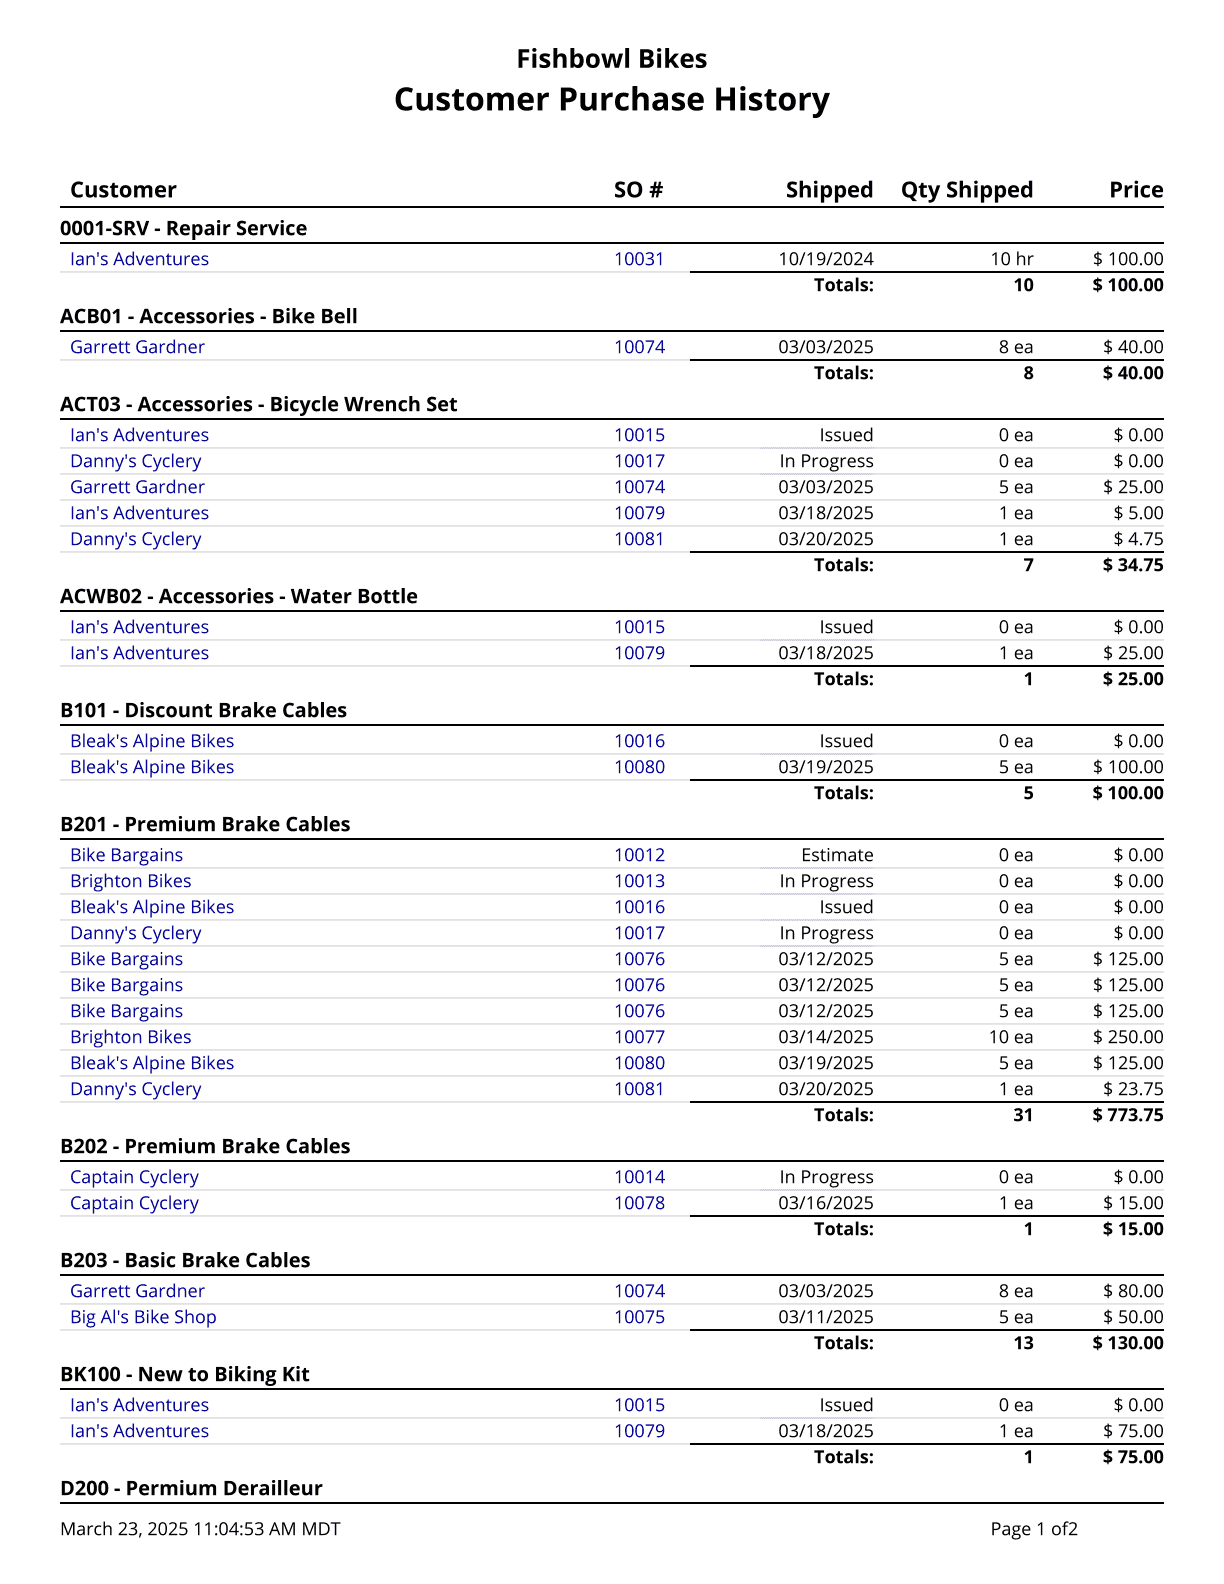
Customer Purchase History - Prints the purchase history for a customer or product in a given date range.
Discount Summary - A list of all discount line items on fulfilled sales orders in the system, totaled by discount.

Gross Sales By Product - Prints the gross sales for the date range specified, ordered from greatest to least. An empty date range will report on gross sales to date.

Gross Sales By Product Tree - Returns gross sales for a specific product tree or all product tree nodes in a specified timeframe. Returns product tree sales as a percentage of total sales and single product sales as a percentage of the respective tree the product belongs to.

Gross Sales By Salesperson - Prints the gross sales for the date range specified, ordered from greatest to least. An empty date range will report on gross sales to date.

Inventory Allocated To Sales Orders - Creates a list of all inventory currently allocated to sales orders. Cost values are based on today's cost.

Margins By Sales Order - Provides a list of Sales Orders' price, profit, and cost. The date filter is based on the date created.

Margins Report - Provides a list of Sales Orders' price, profit, and cost.

MTD Sales - Prints a graph of gross sales for the date range specified. An empty date range will report on gross sales to date.

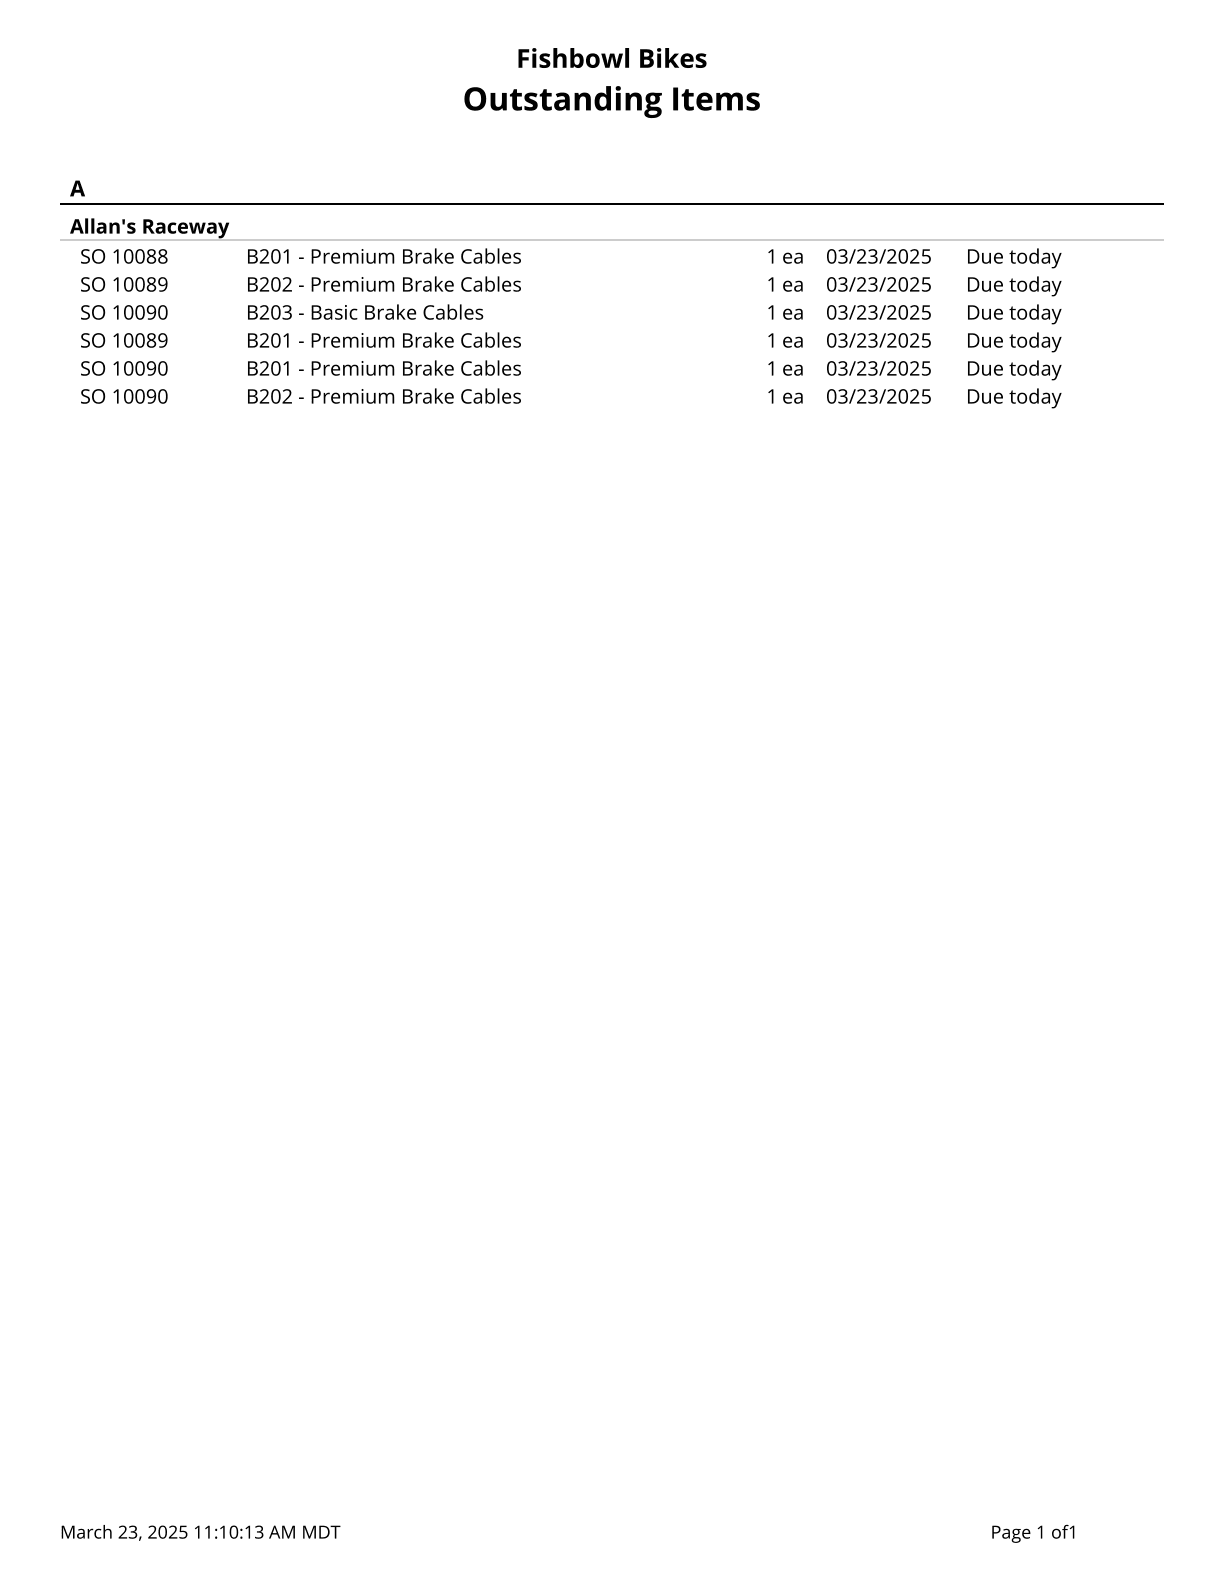
Outstanding Items - Prints a list of outstanding exchange items. Can be filtered by due date and/or customer.
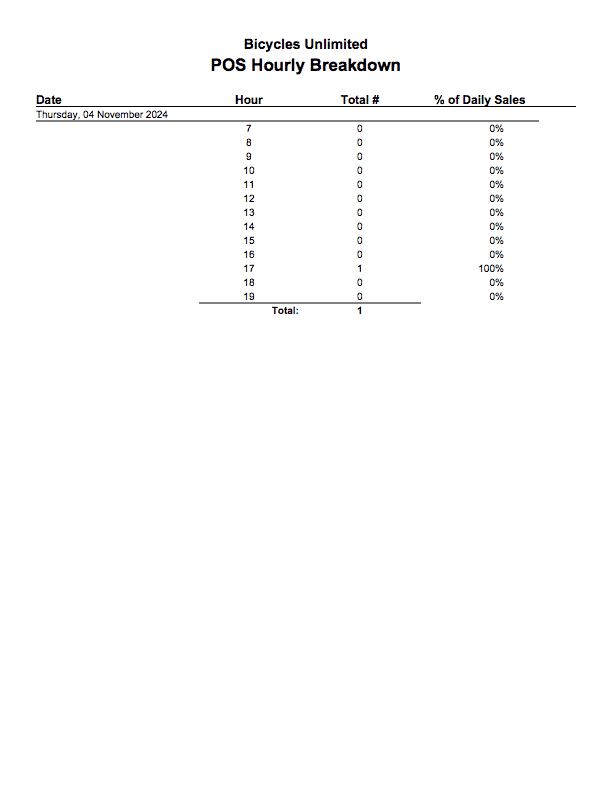
POS Hourly Breakdown - Pulls all sales made with Fishbowl Checkout and shows how many sales were made per hour in a given date range. Shows a graph of the average amount of sales per hour.
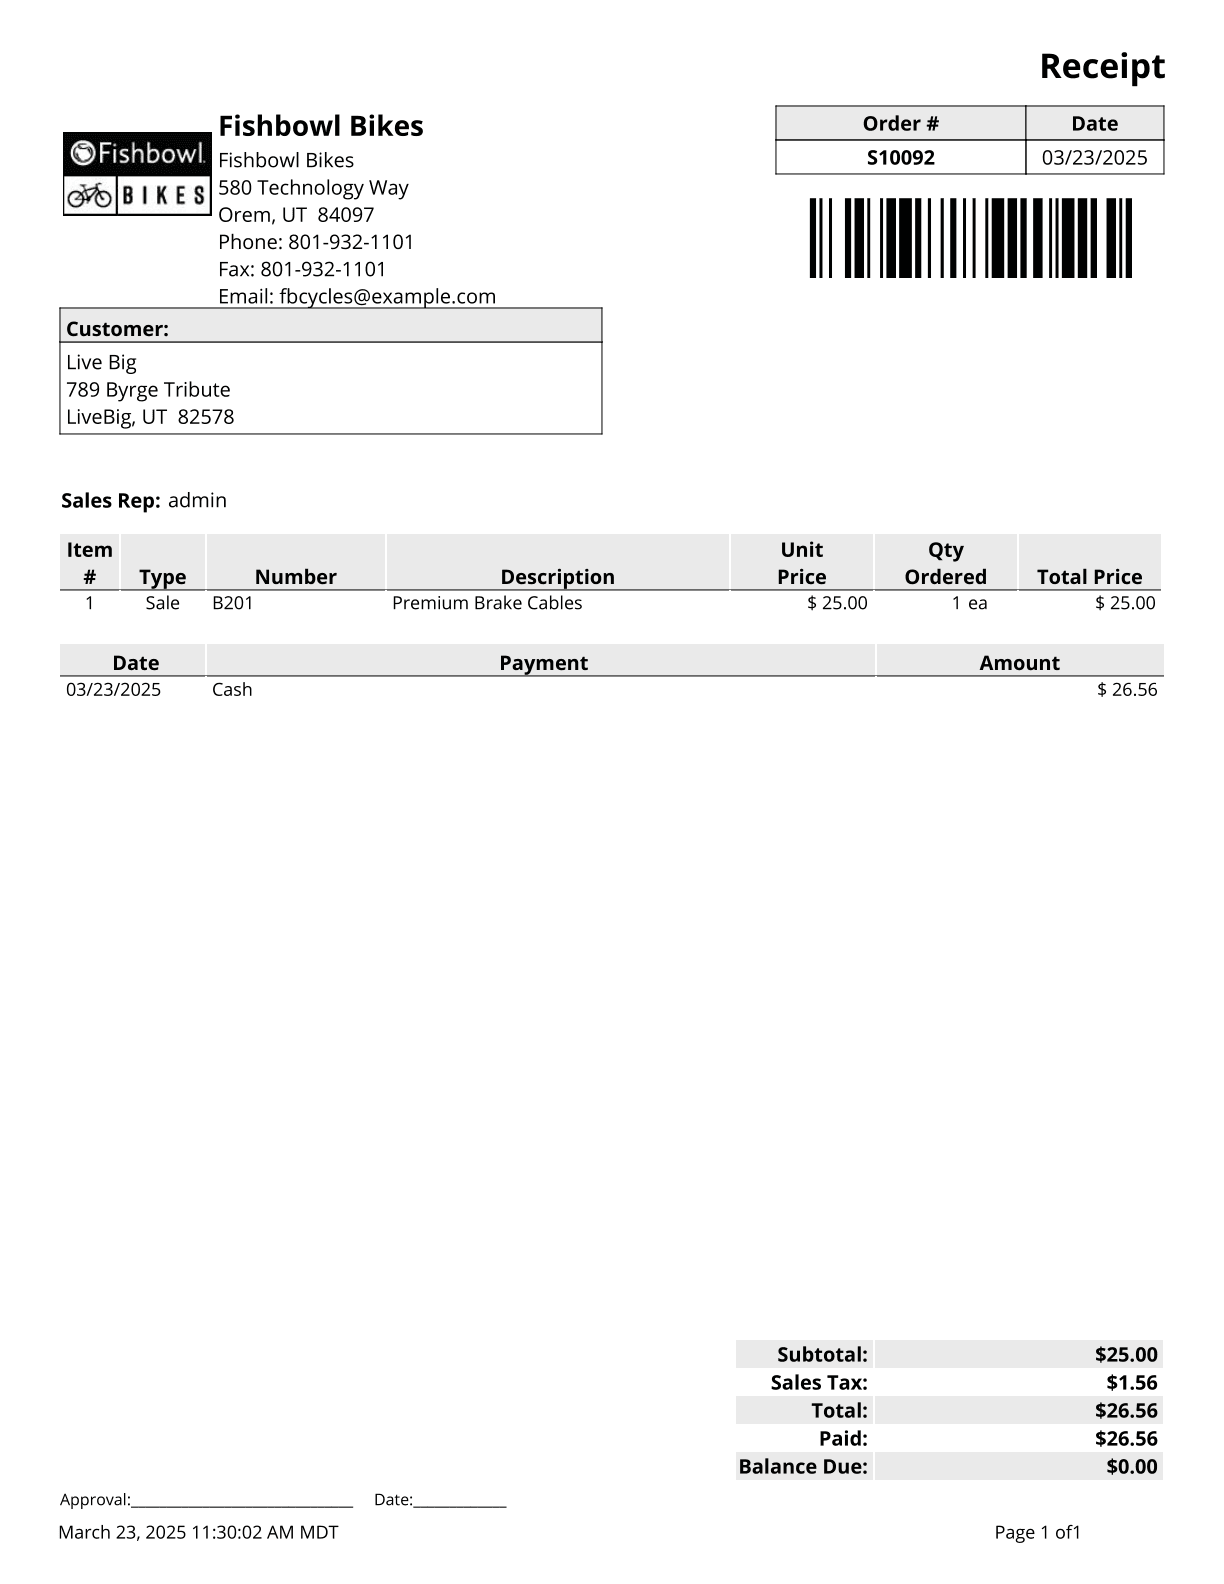
POS Receipt - Common Receipt for Customers.
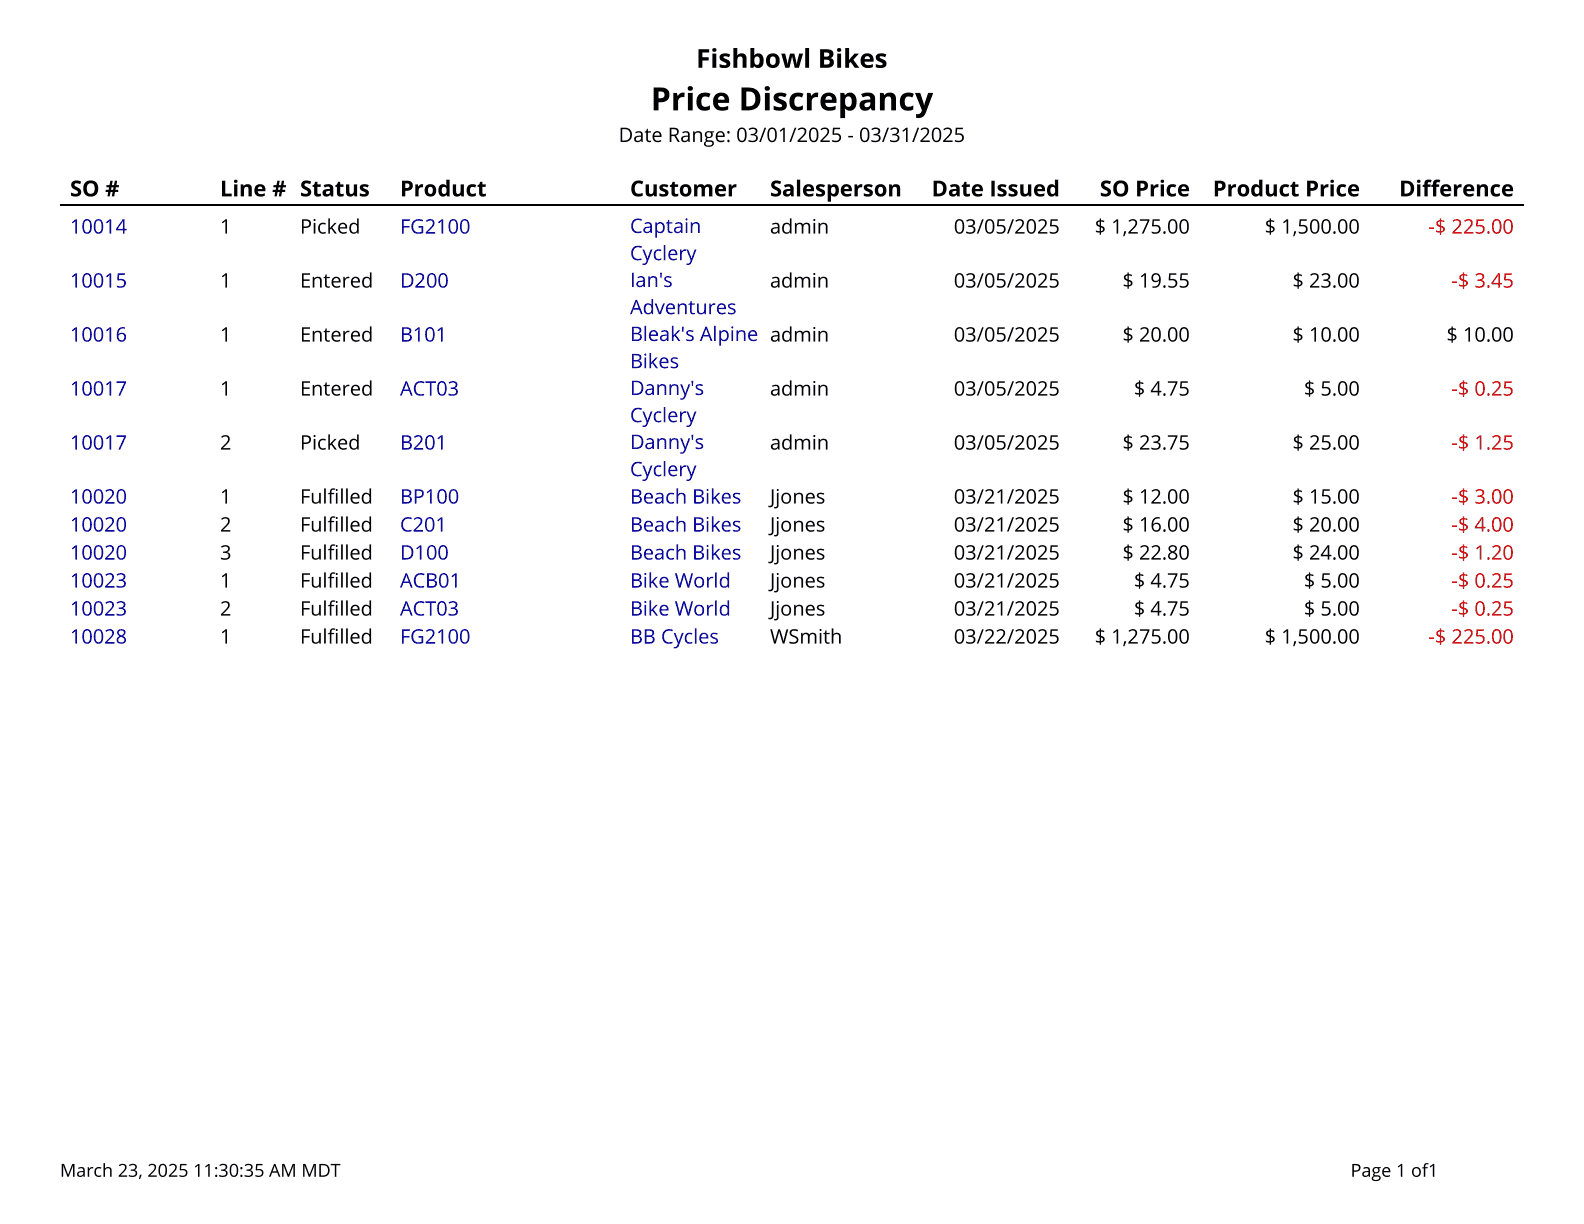
Price Discrepancy - A list of all SO Items in the system that have a price different than the list price.
Pricing Rules - Provides a list of pricing rules set up in the system.

Products On Order - Shows which products customers have on order.

Receipt 2in - Common Receipt for Customers.

Receipt 3in - Common Receipt for Customers.

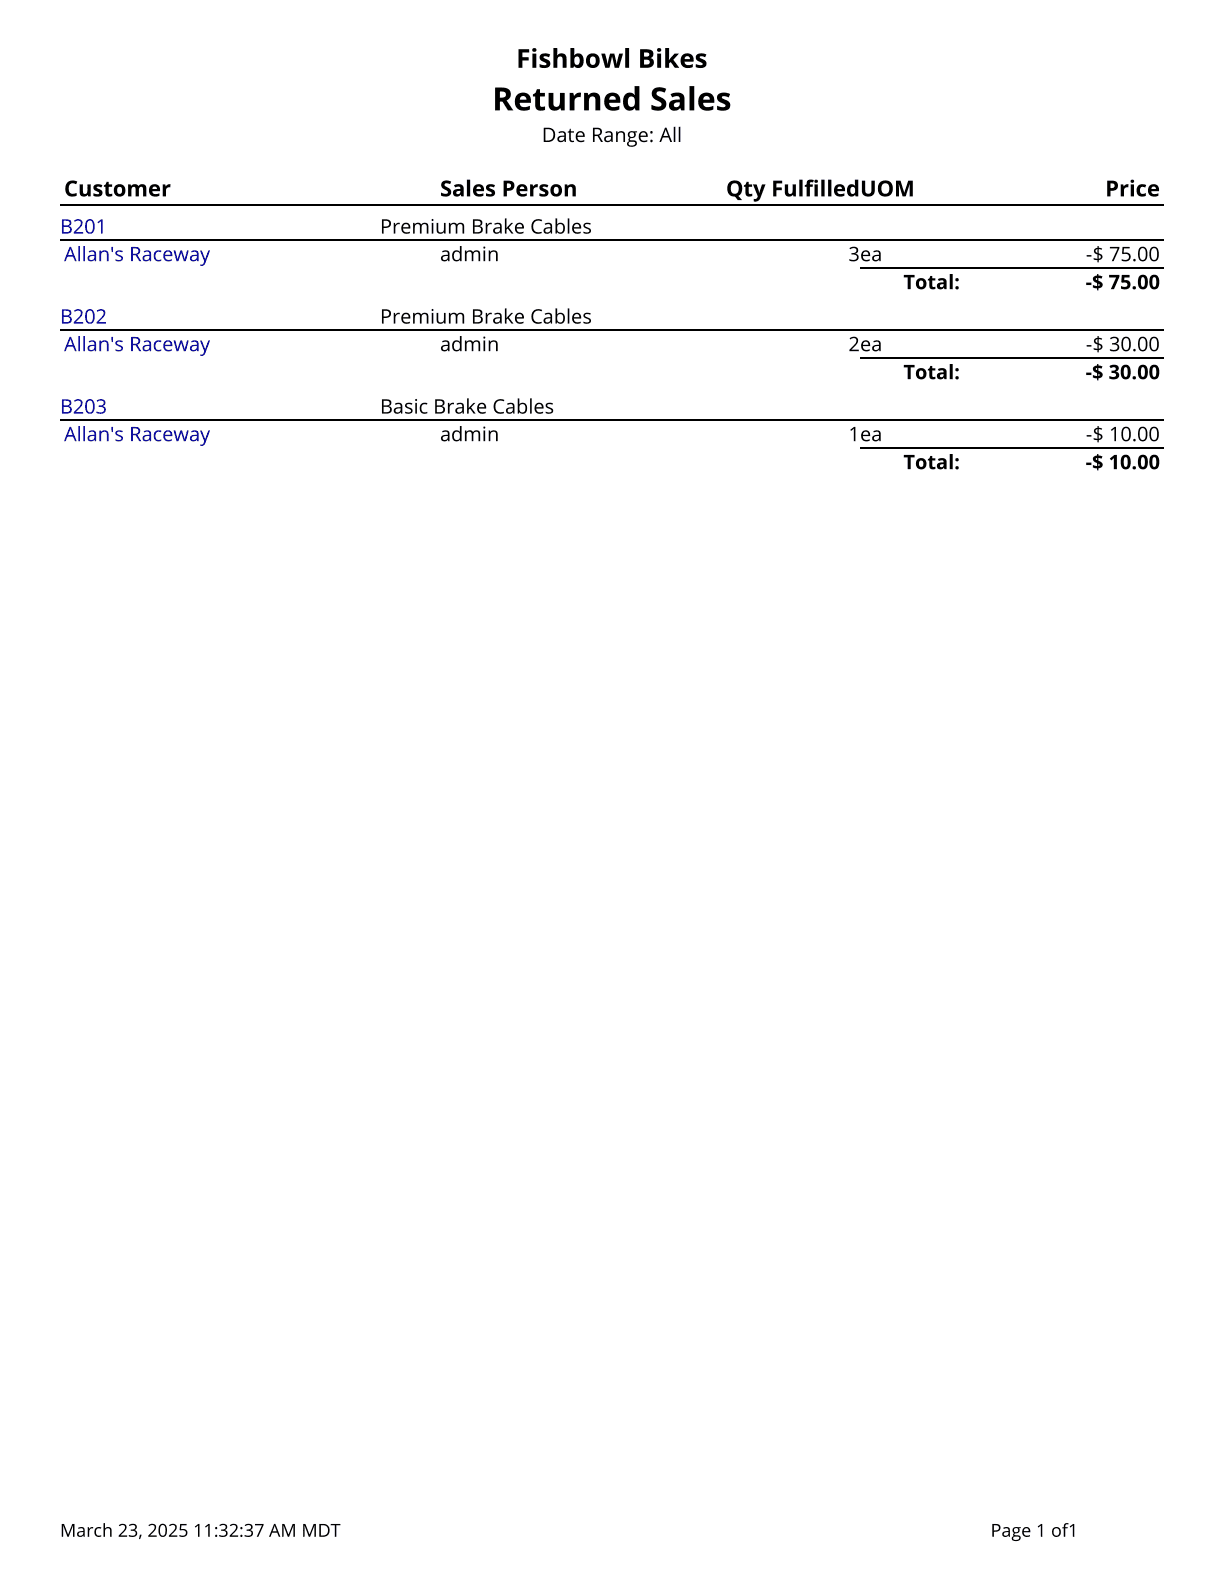
Returned Sales - Prints a list of returned sales items by count for the date range specified.
Sales Backorder Report - Displays Sales Orders that are fulfillable or on Backorder. The quantity shown is the quantity on hand without quantity in not-available locations.

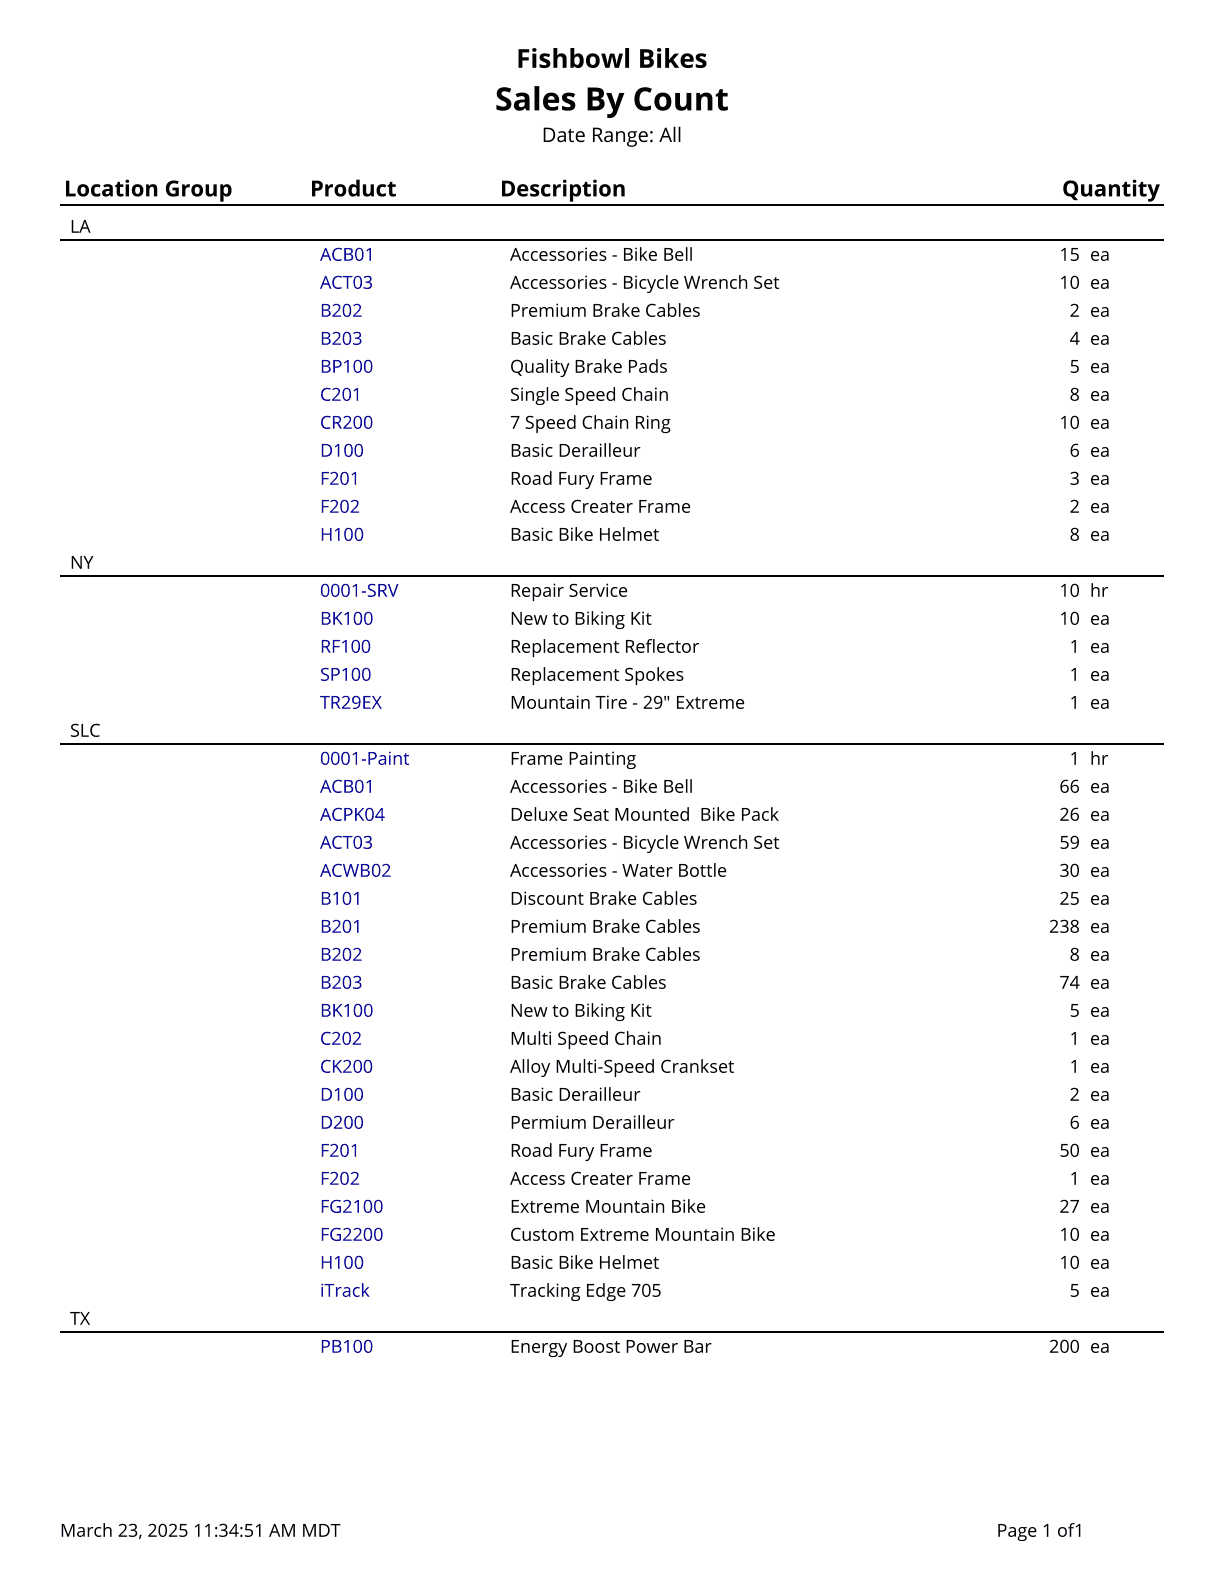
Sales By Count - Prints a list of sales by count for orders that have items shipped during the date range specified.
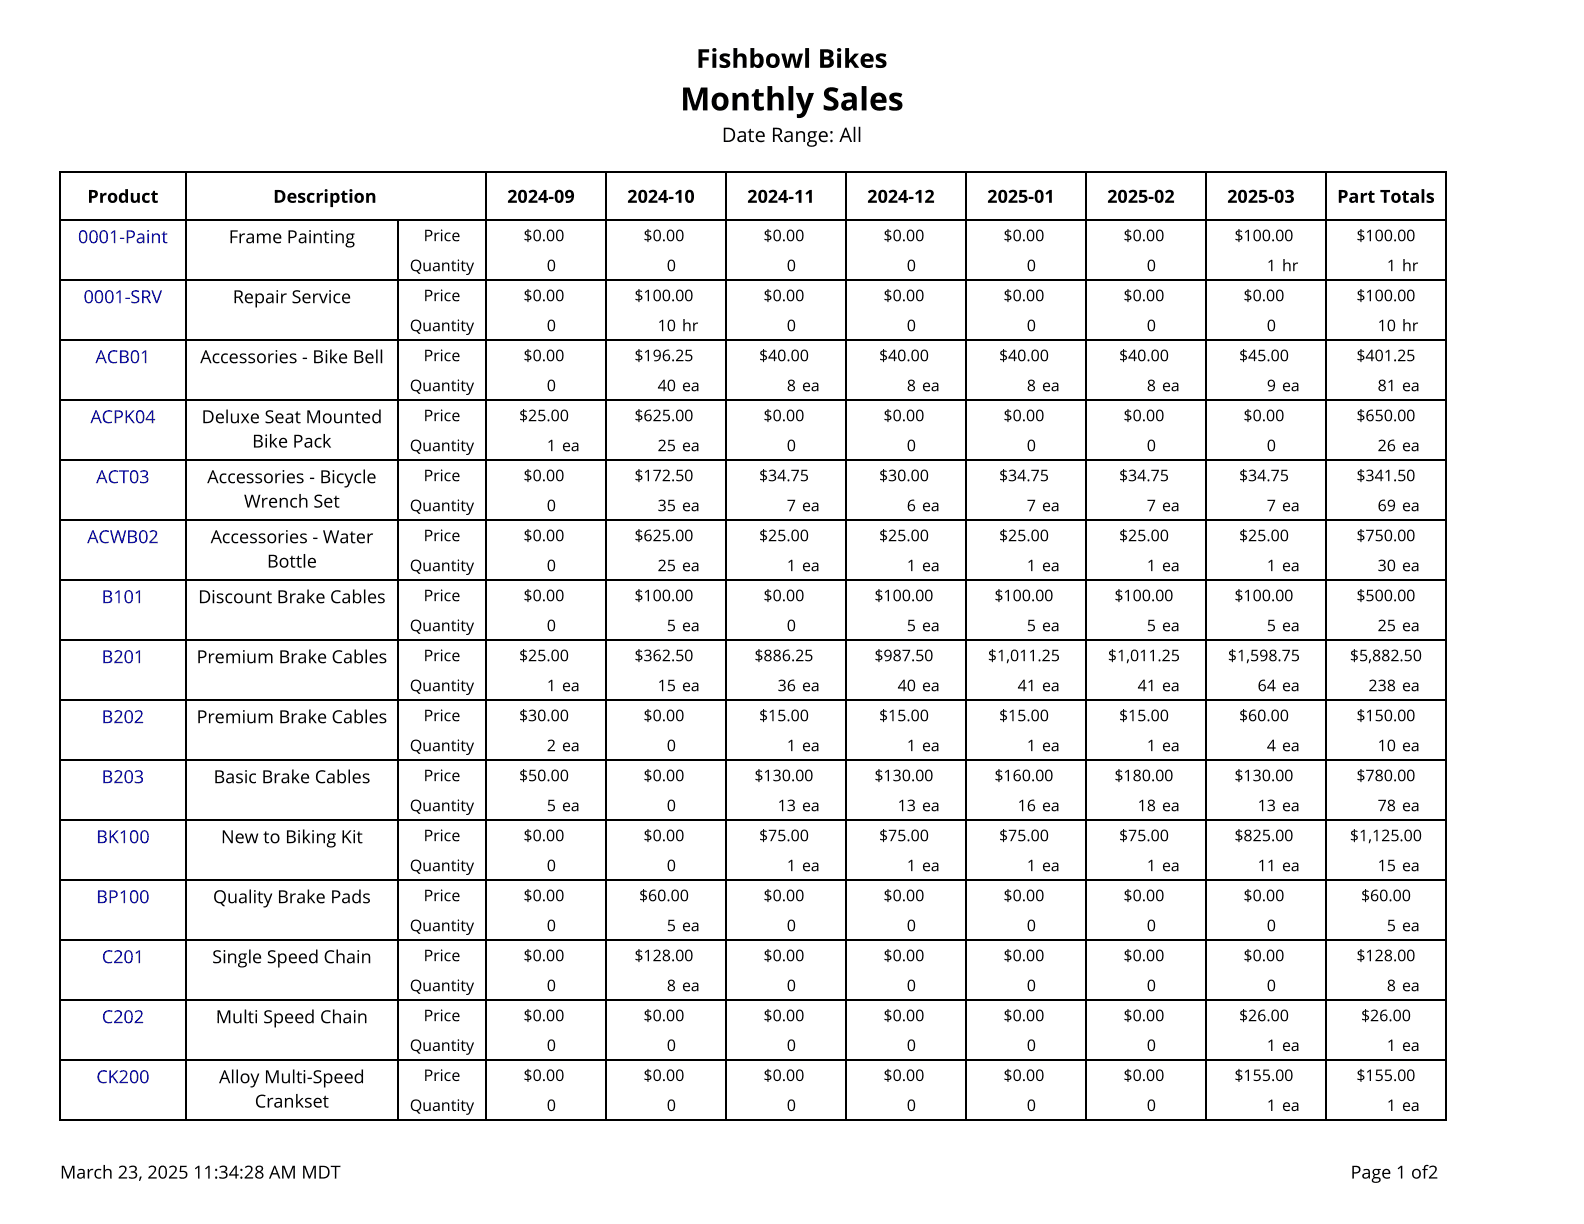
Sales By Month - Shows product sales broken out by month.
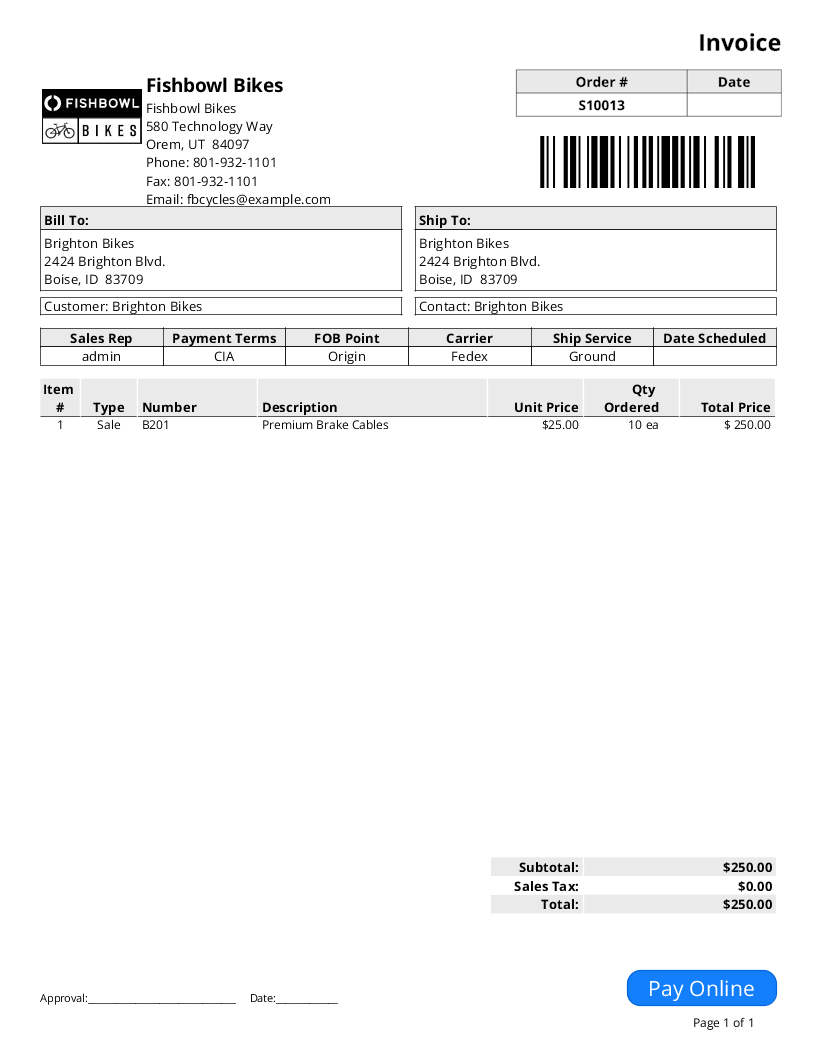
Sales Invoice - Sales Order Report with Invoice displayed at the top of the report.
Sales Order Report - Basic Report for Sales Orders.

Sales Order Summary - Prints a summary of sales orders issued during the time window given; no taxes are included.

Sales Order Summary Export - Exports a summary of sales orders issued during the time window given; no taxes are included.

Sales Order Taxes - Prints the tax rate and total tax on a list of sales orders.

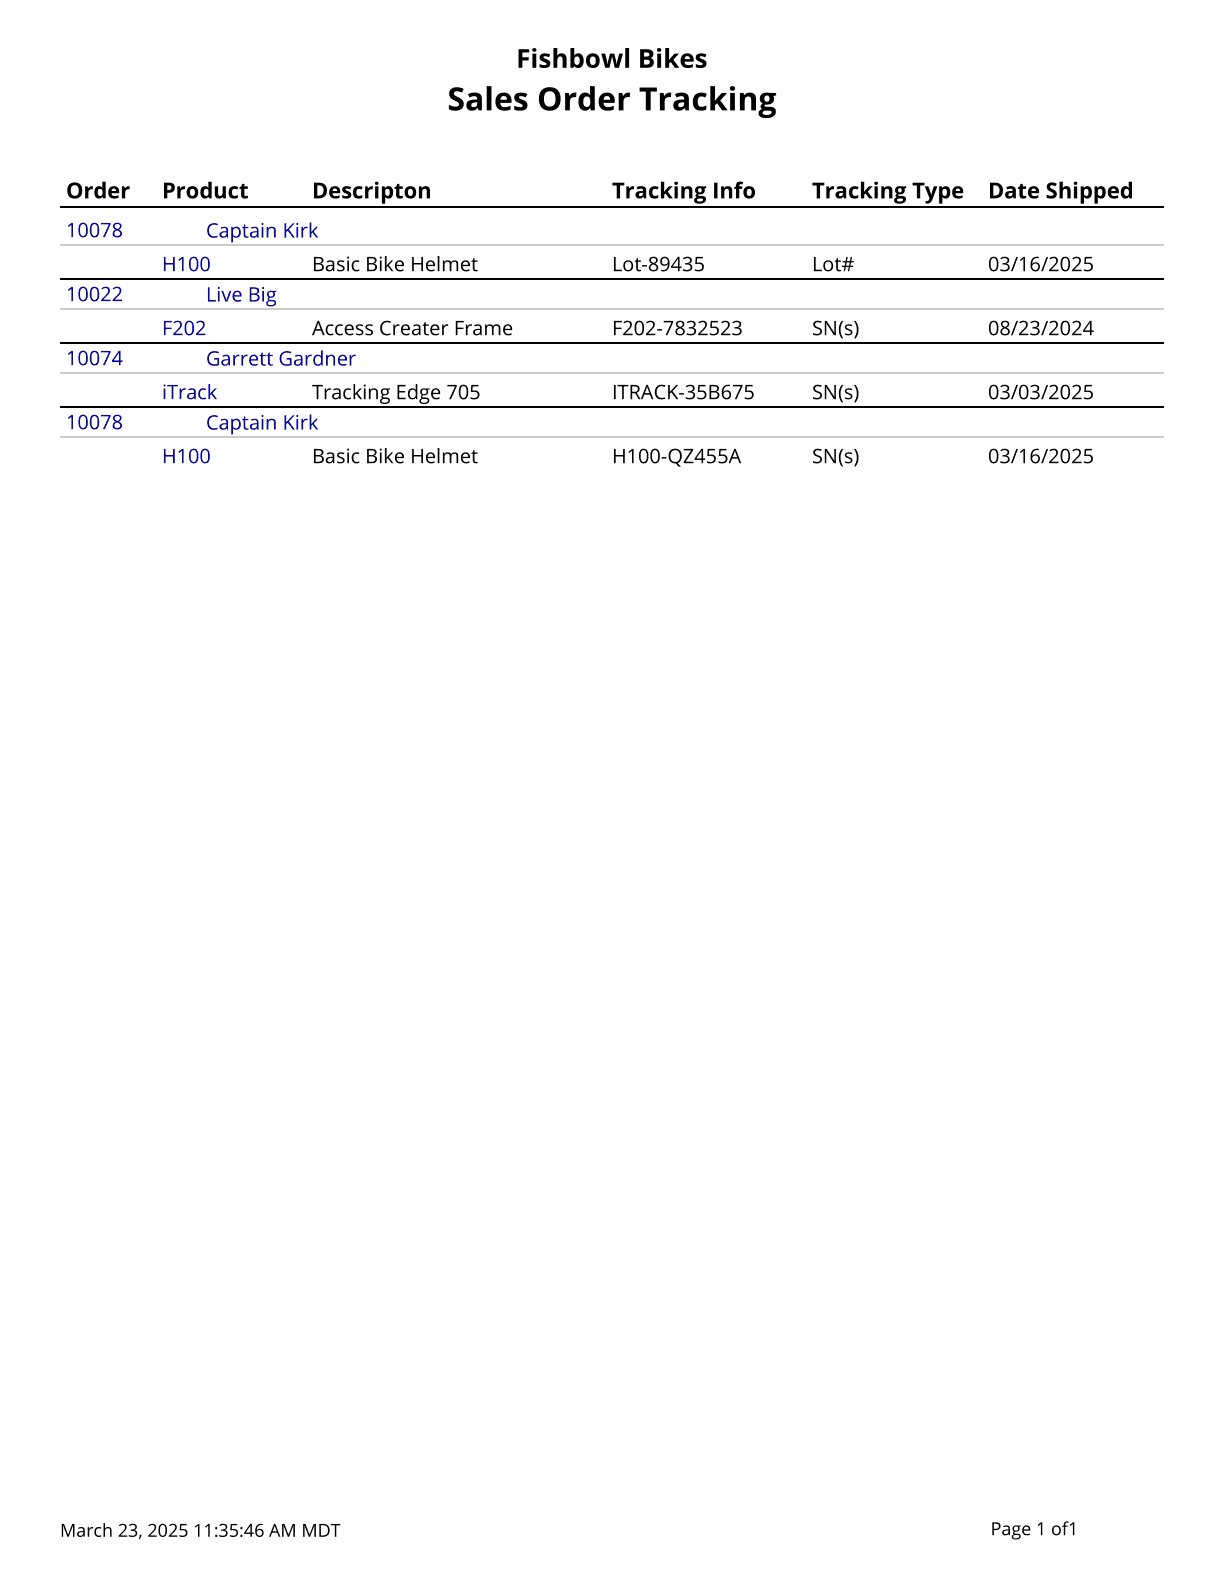
Sales Order Tracking - A list of tracking values associated with items on a sales order.
Sales Production Demand - Shows the time and inventory demand generated by open sales orders.

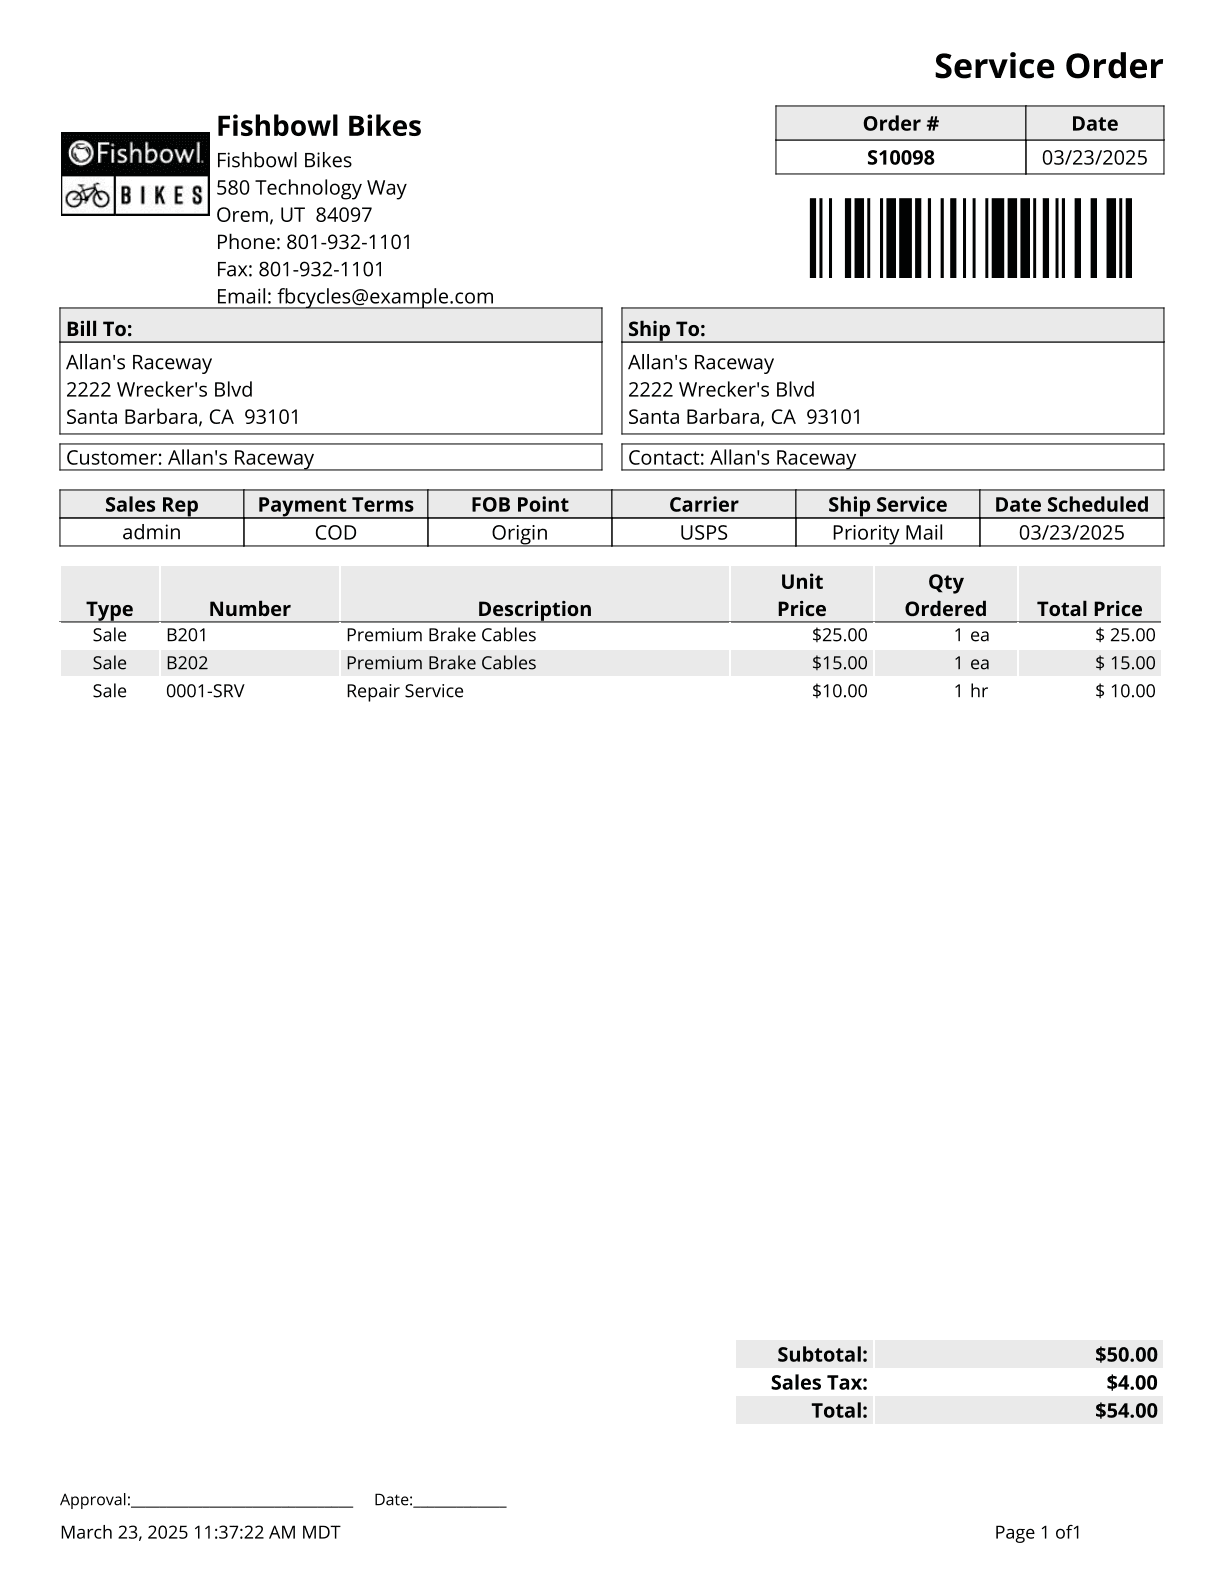
Service Order - Service Order Report shows sales order information with a section for service parts used on the order.
SO To PO Margin - Shows the margins of Sales Orders where a Purchase Order is associated with a Sales Order.

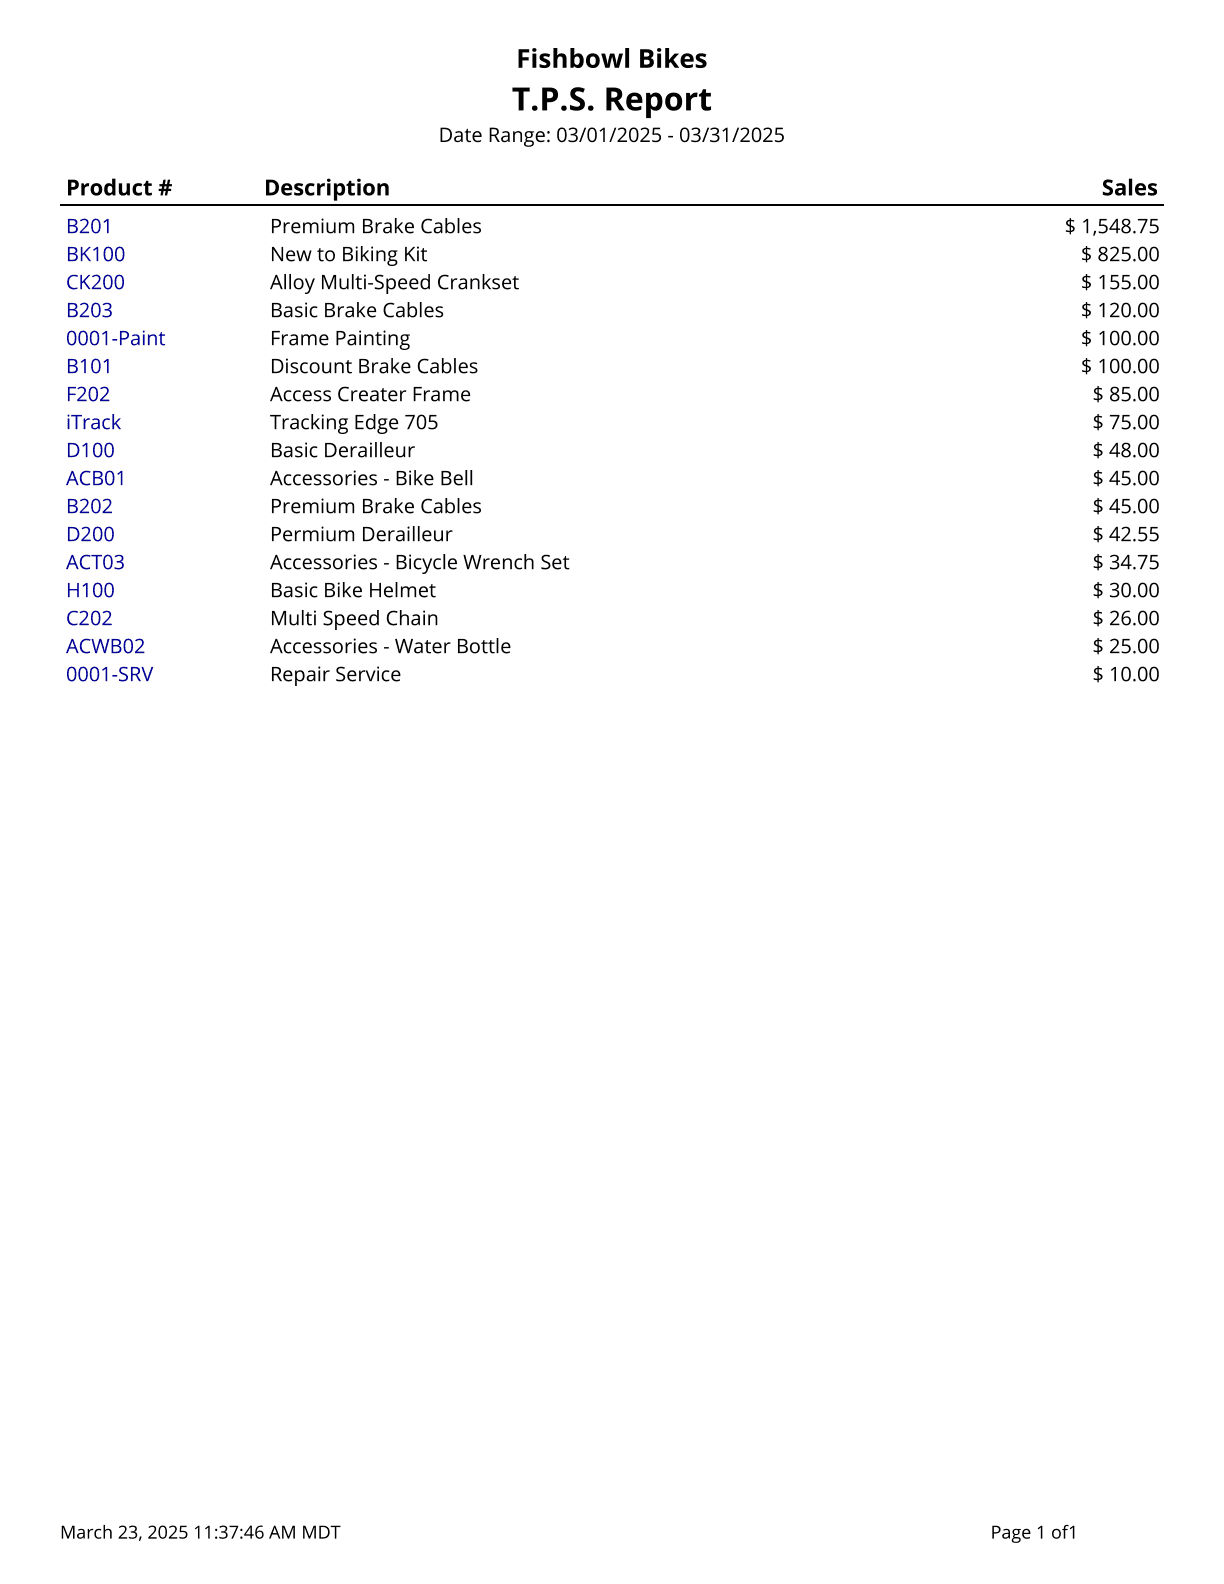
TPS Report - Total Product Sales. Prints a list of gross sales for the date range specified, ordered from greatest to least. An empty date range will report on gross sales to date.
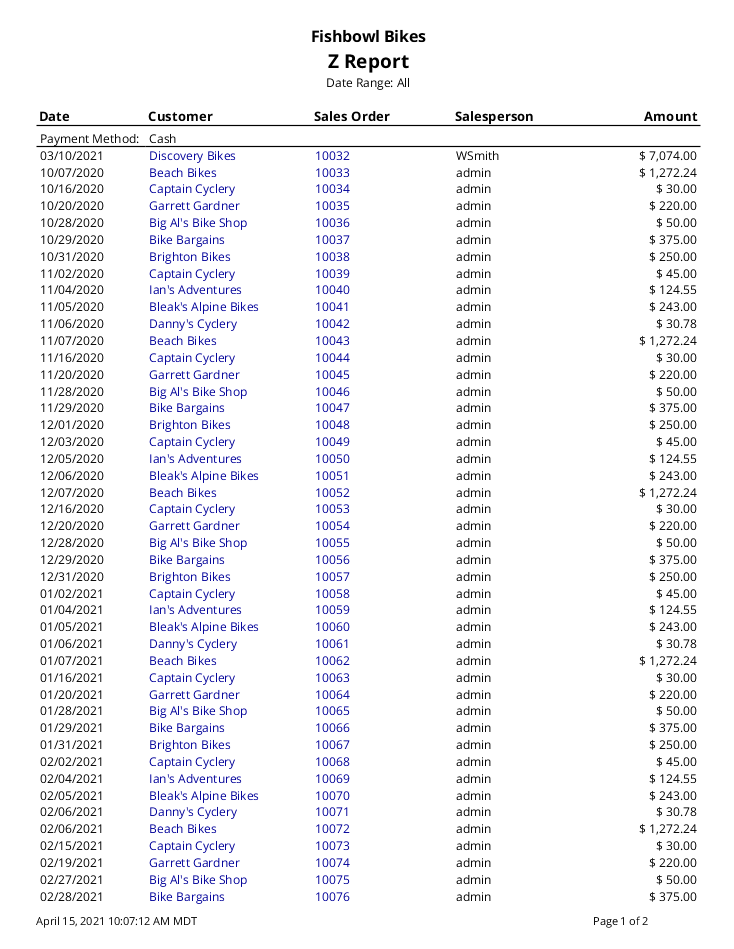
Z Report - Prints all payments posted in Fishbowl for the date range specified.
|
| Ship
Bill Of Lading - A Bill of Lading Form to be filled out when needed for shipping.

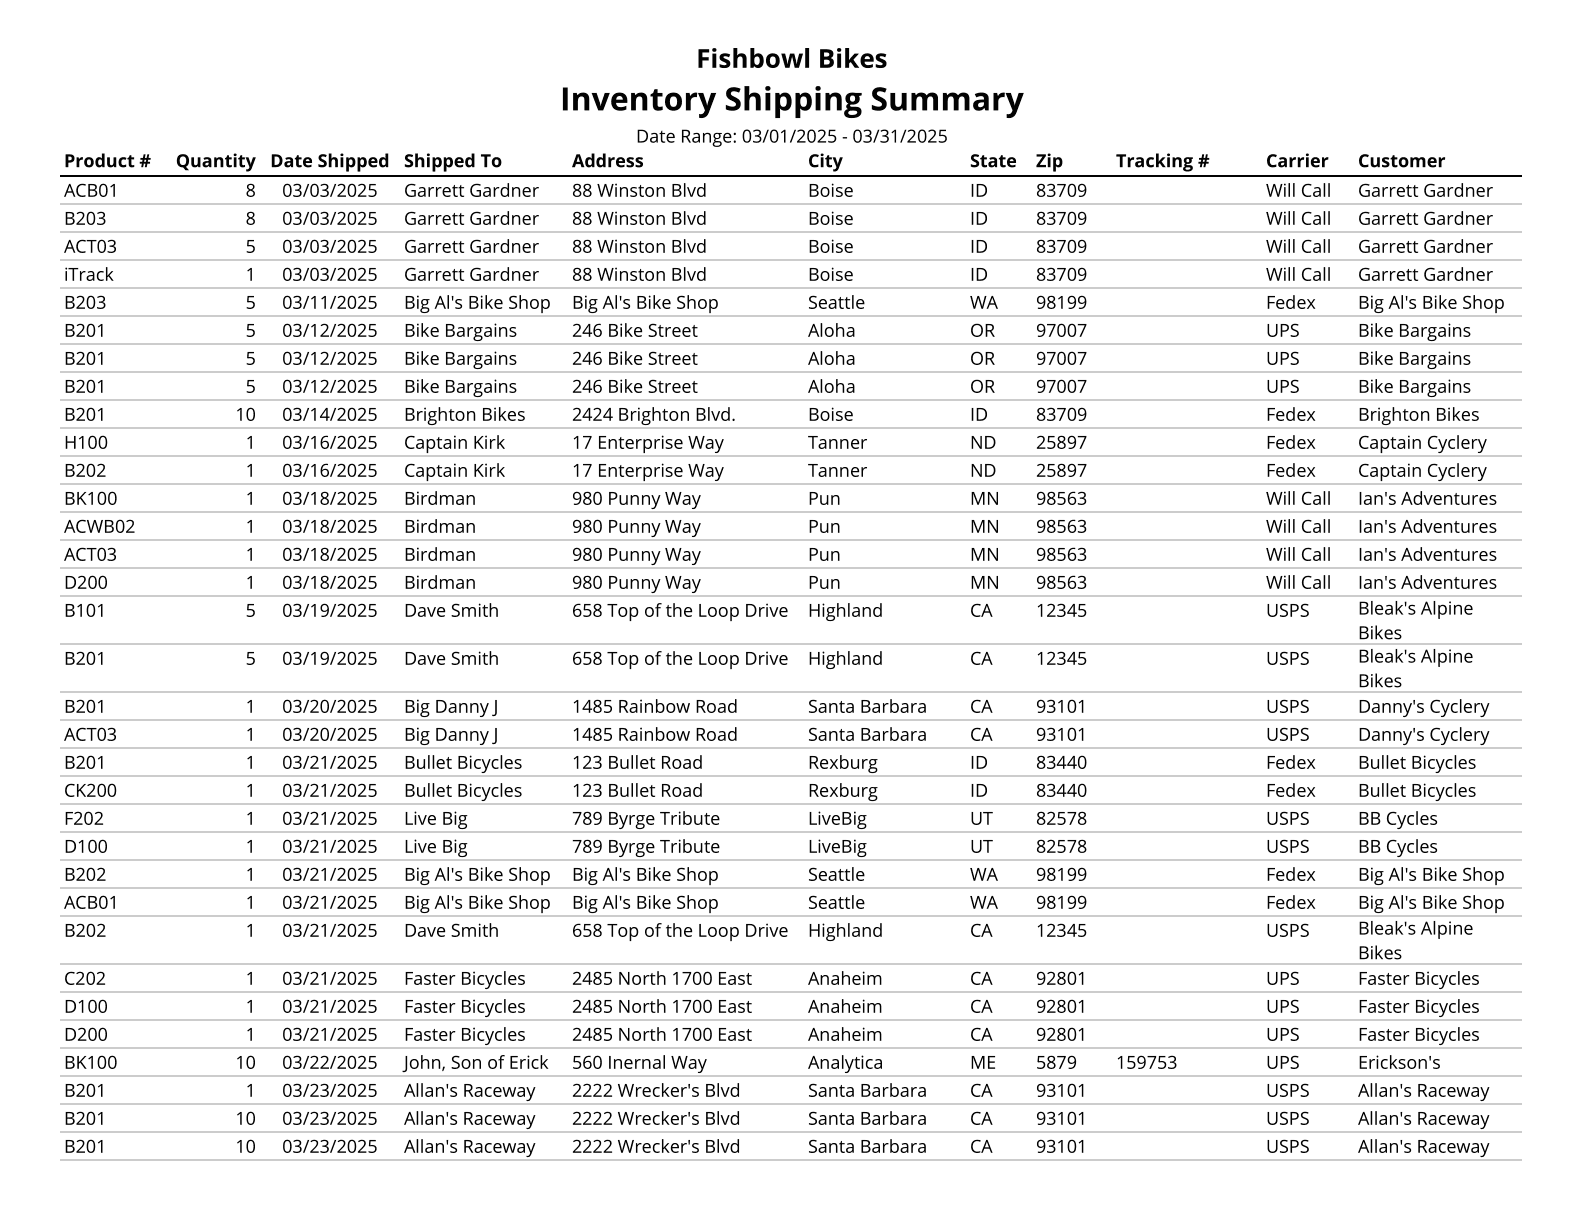
Inventory Shipping Summary - Report will show inventory that has been shipped within a specified date range.
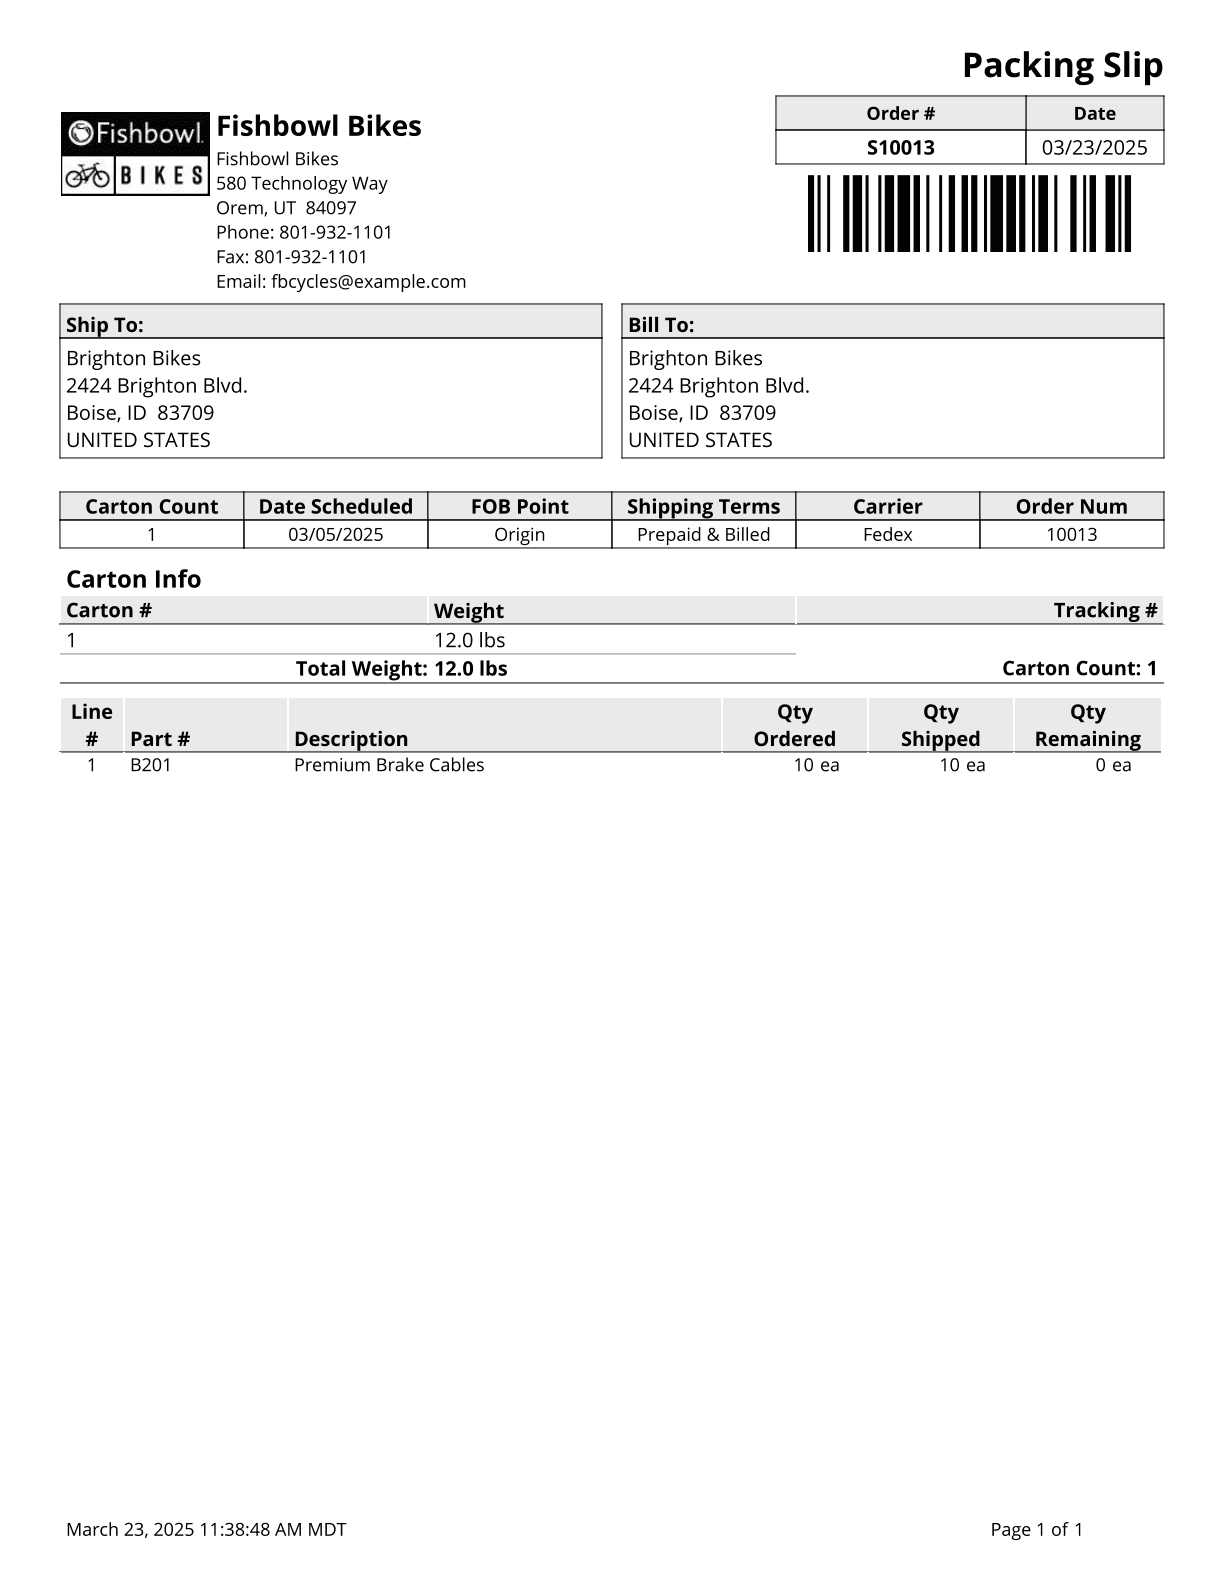
Packing List - Packing List for a selected order. Selecting Standard or By Location layouts will include backorder items.
Shipment History - Prints a list of all shipments made in the specified time period.

Shipping Invoice - Displays shipped products and their prices. Also includes other items on the order, such as discounts, tax rates, miscellaneous items, and subtotals.
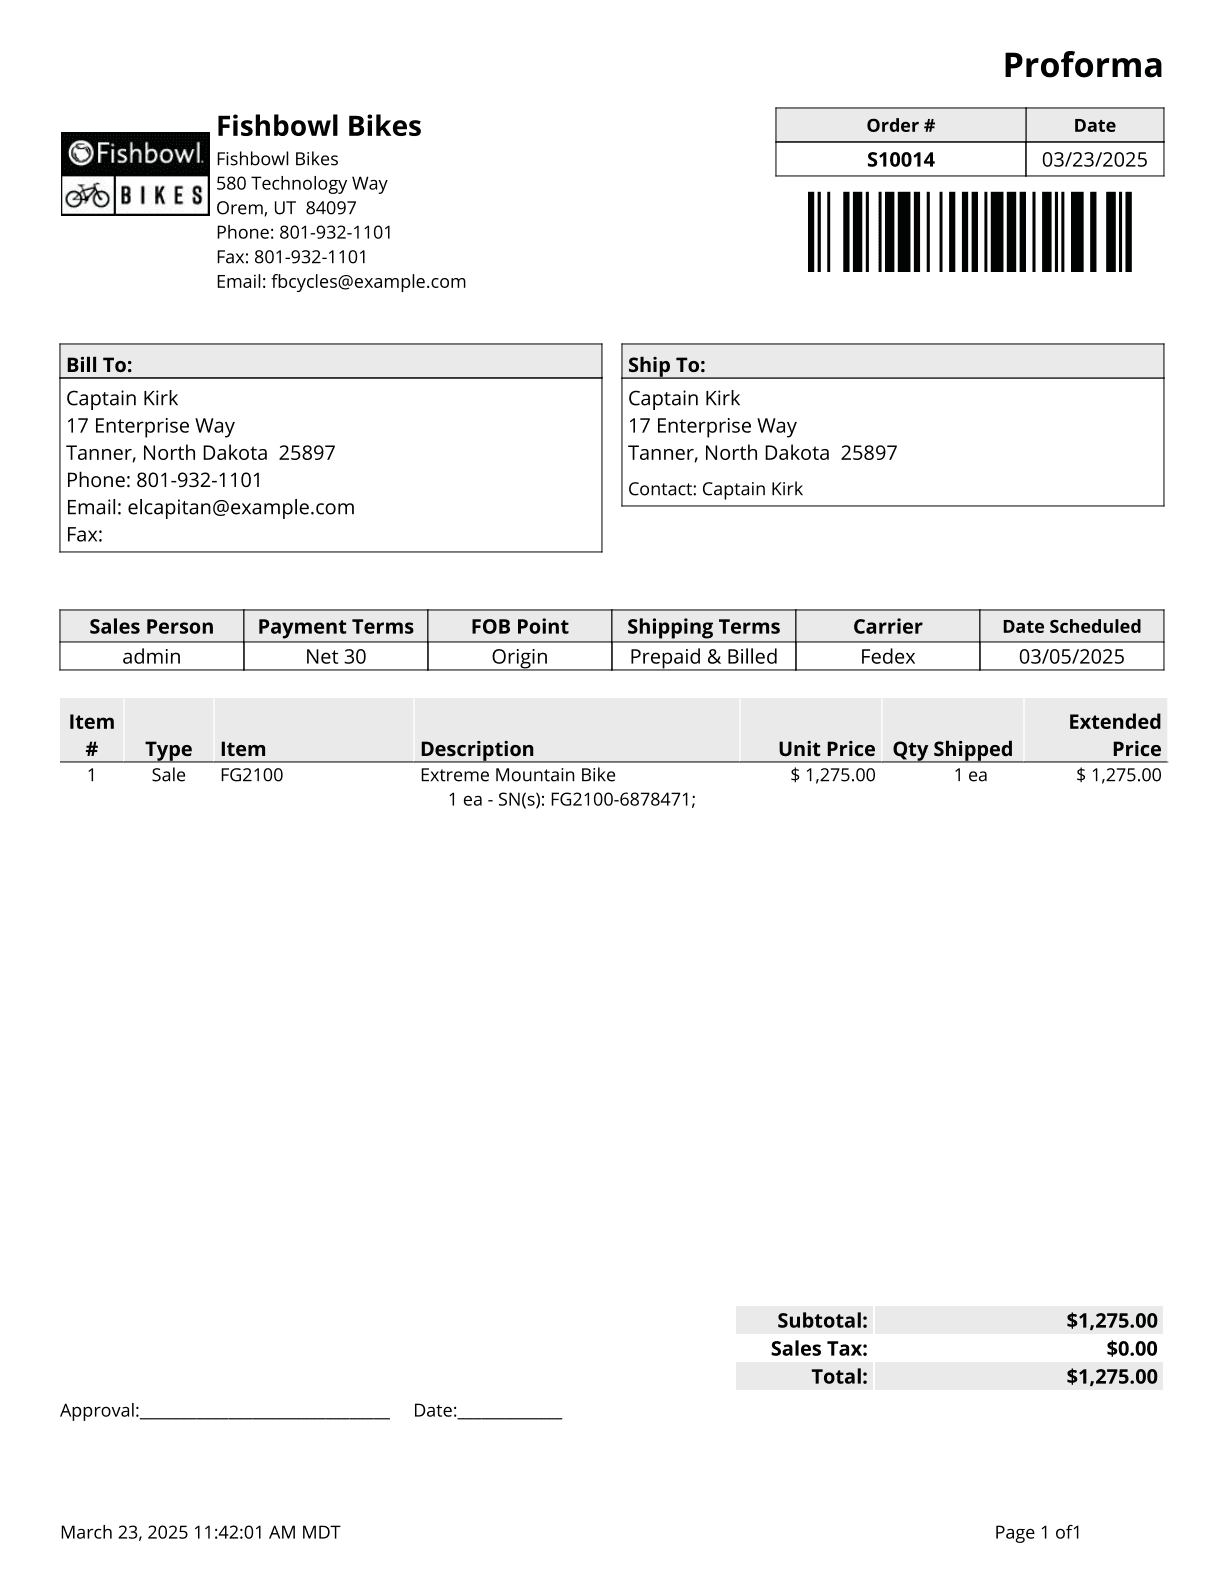
UPS High Value Report - High Value report for shipments with a declared value over $1,000.

|
| Transfer Order
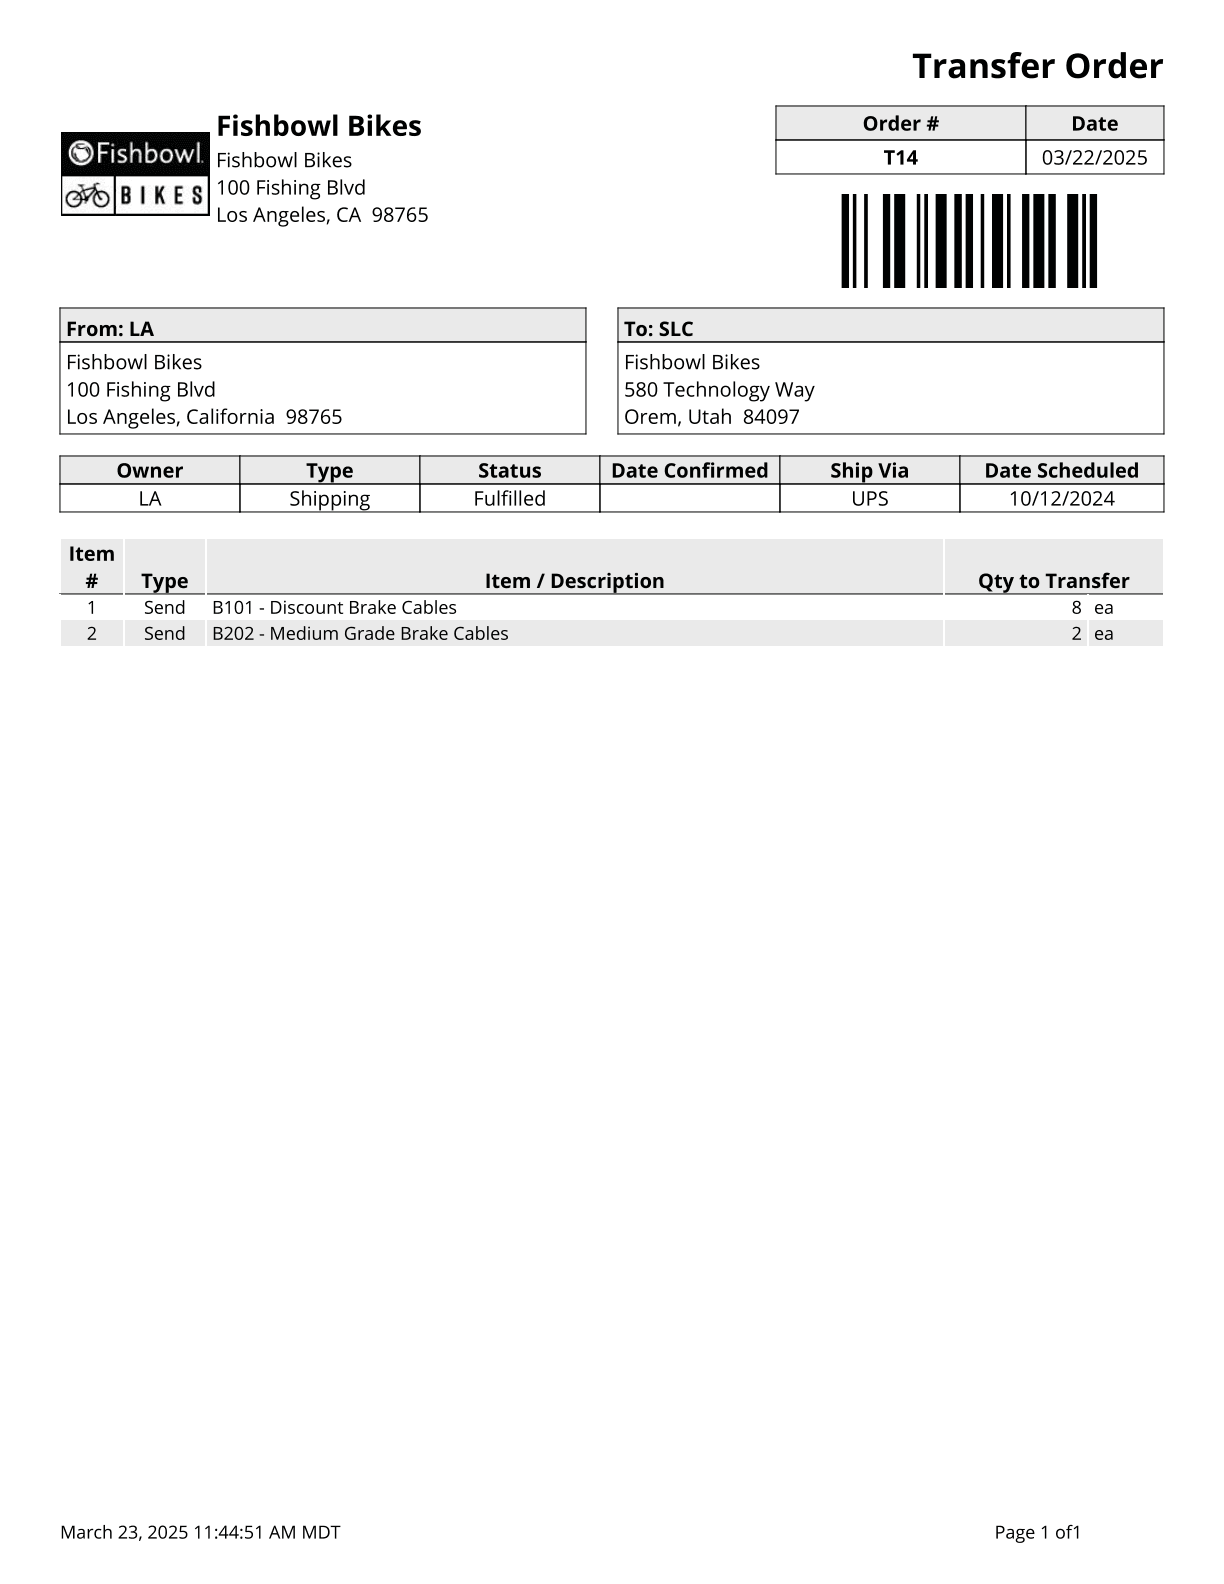
Transfer Order Report - Basic Report for Transfer Orders.
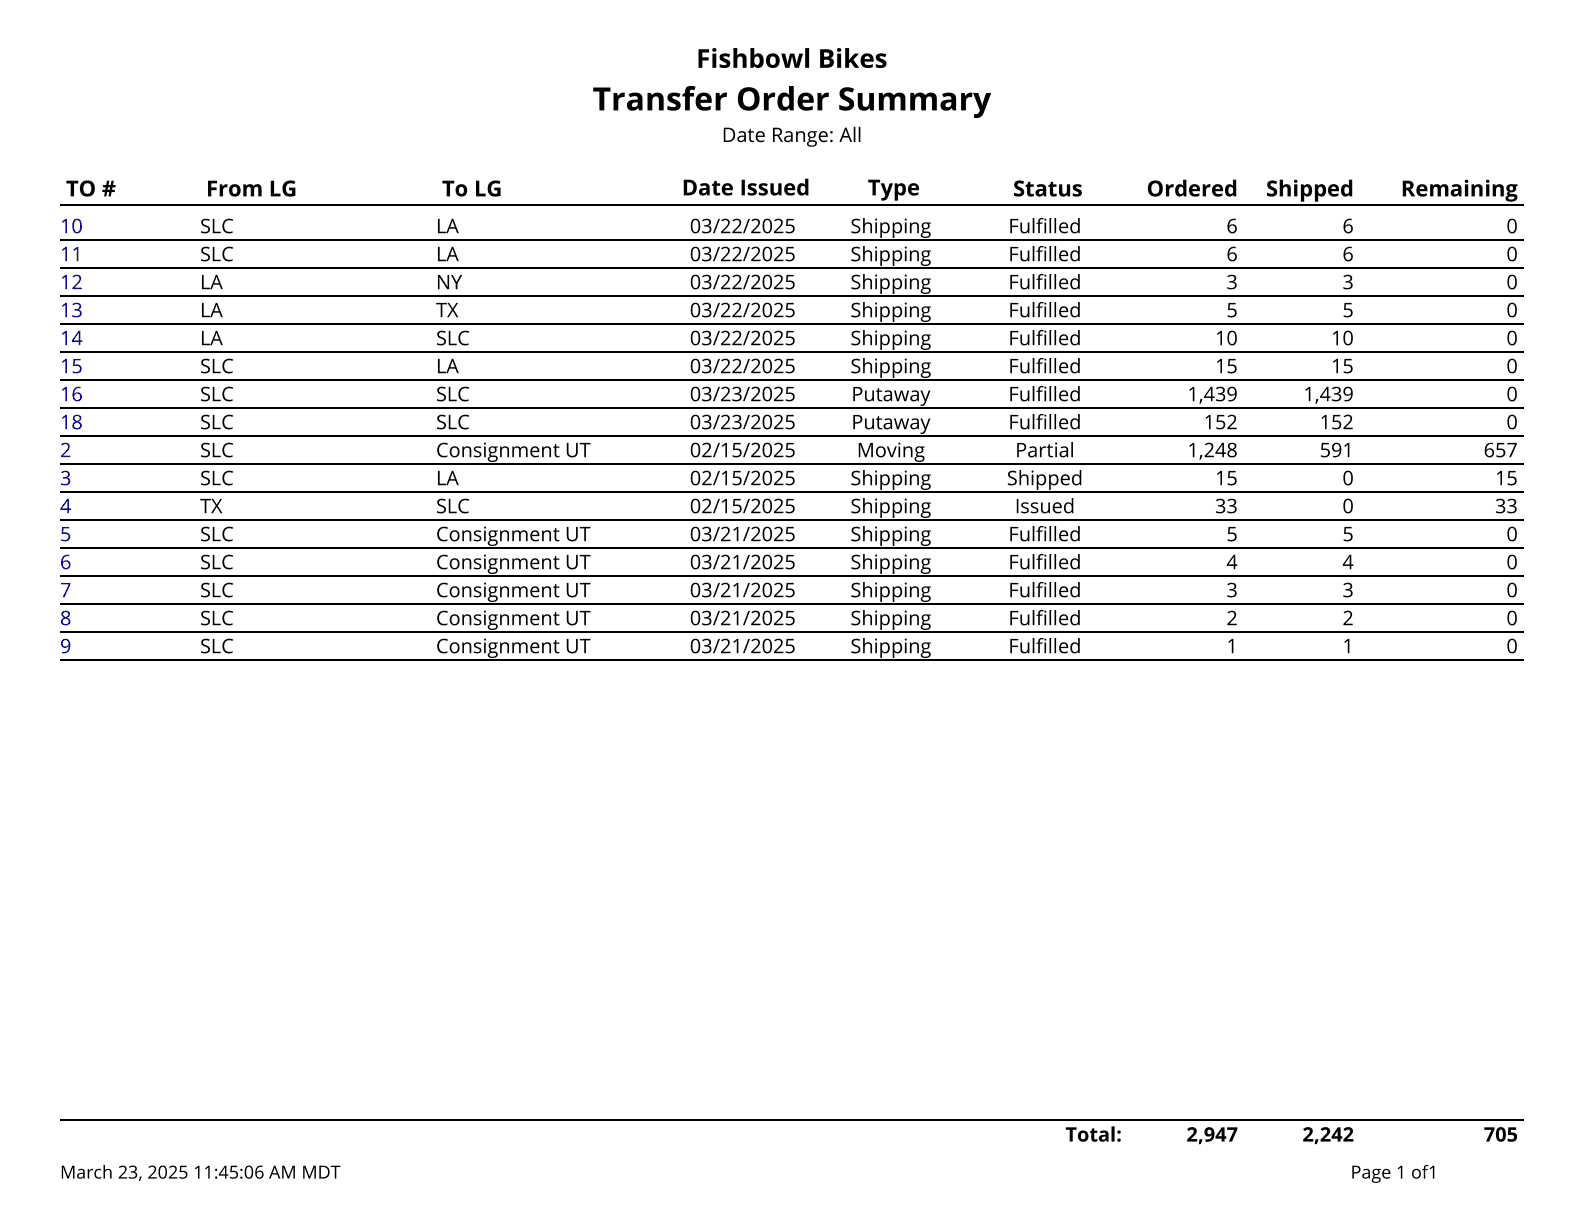
Transfer Order Summary - Prints a summary of transfer orders during the time window given.
|
| User
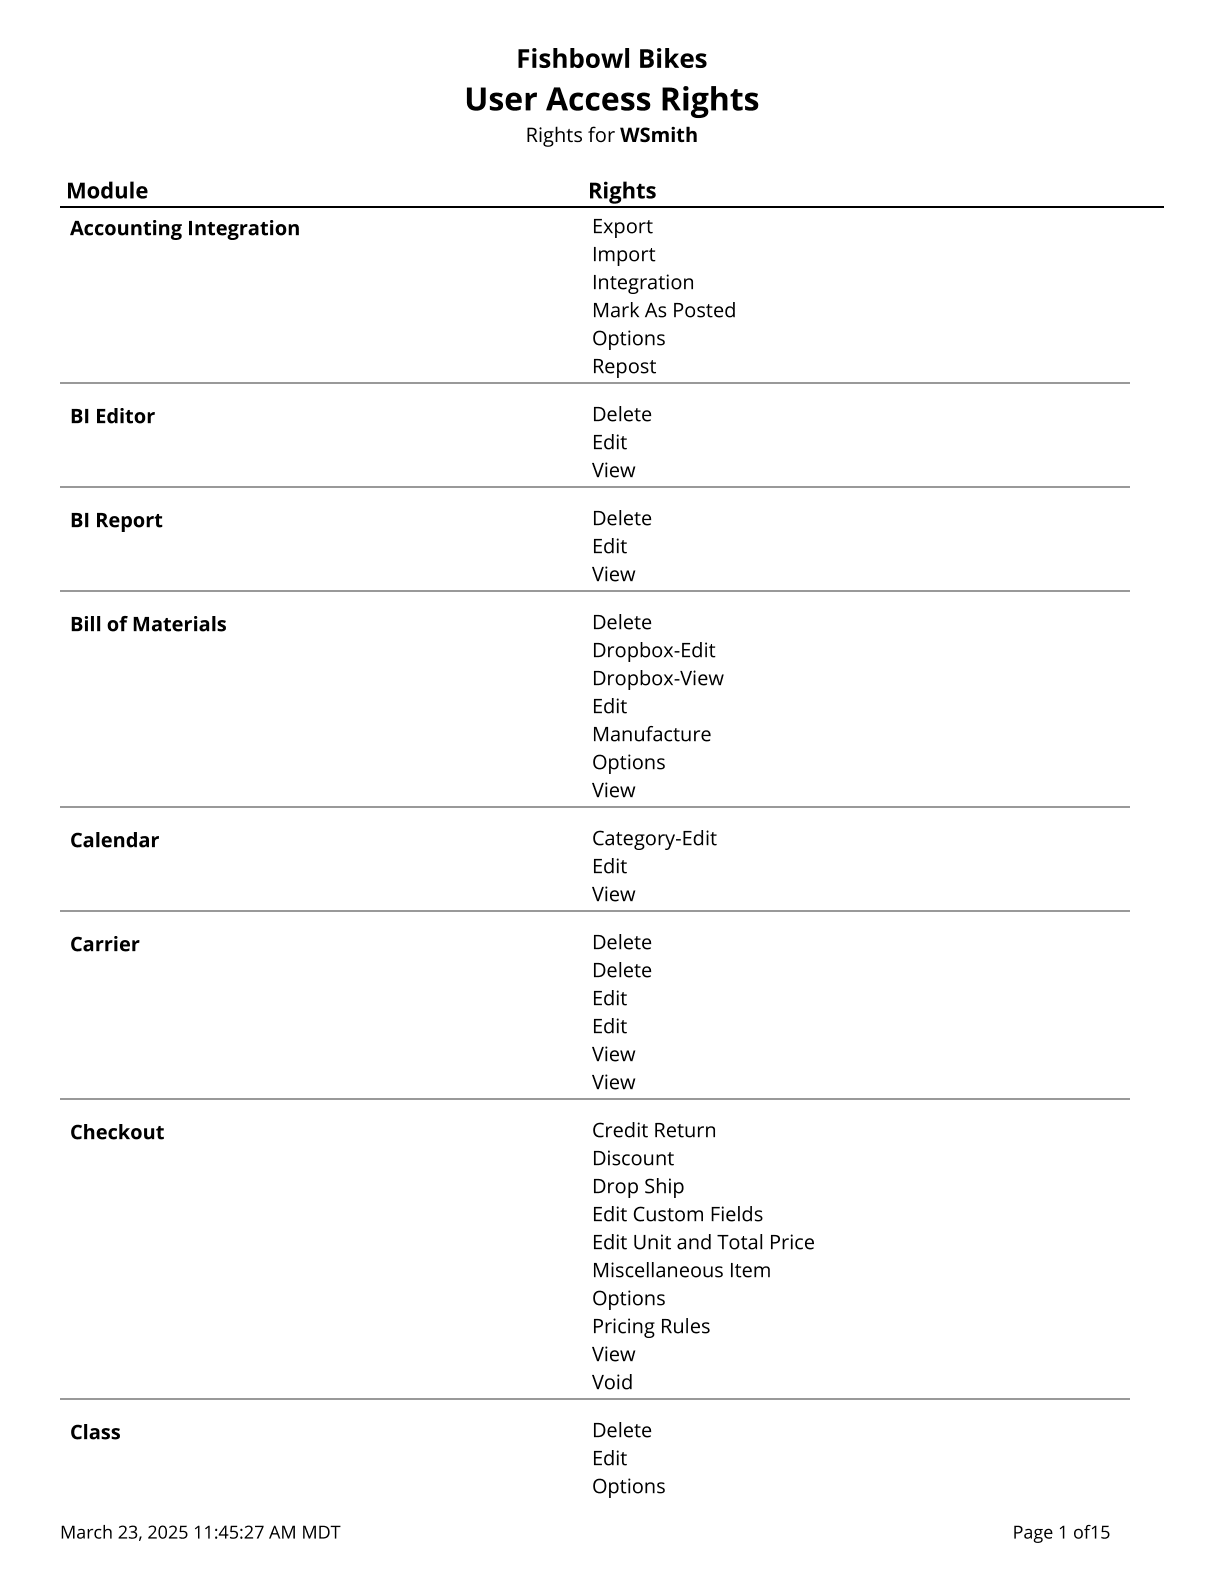
User Access Rights - List of access rights for a specified user.
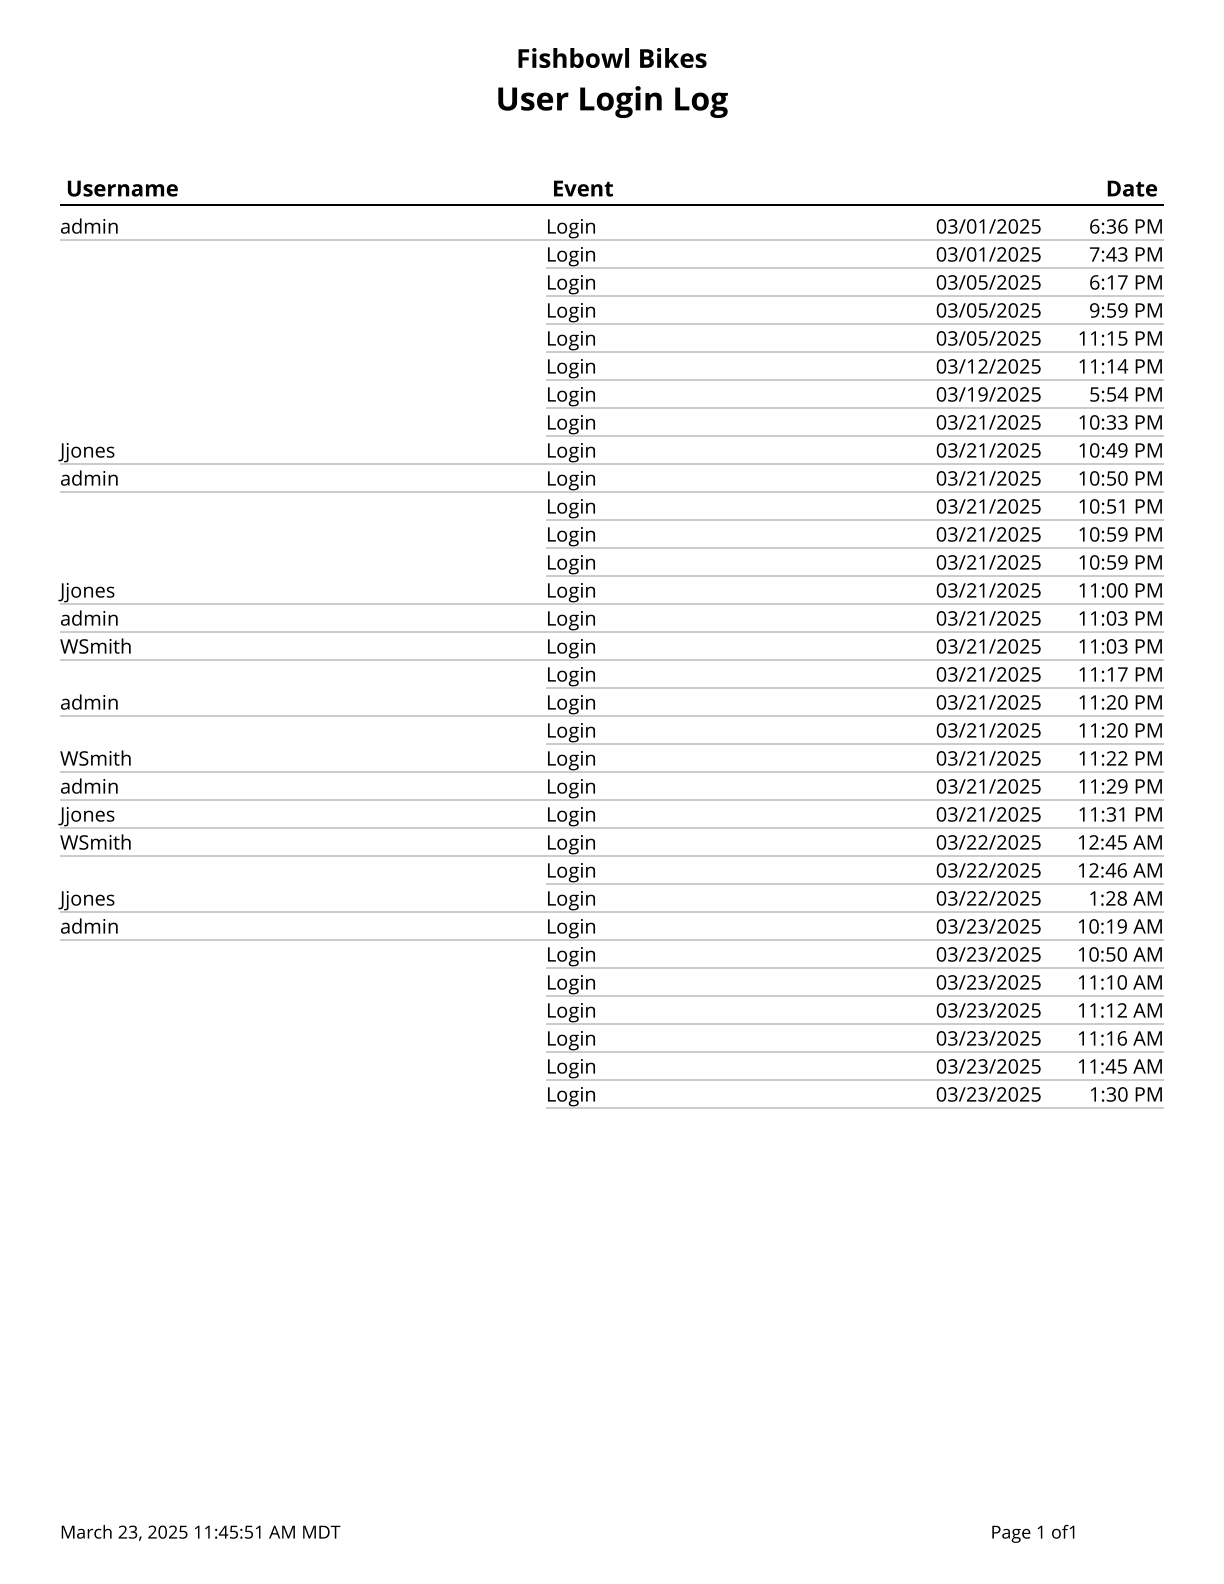
User Login Log - List of logins and logouts made be users to the Fishbowl system.
|
| Vendor
Part Vendor List - Lists all vendors who sell a part, as well as the date and unit cost of the last purchase made.

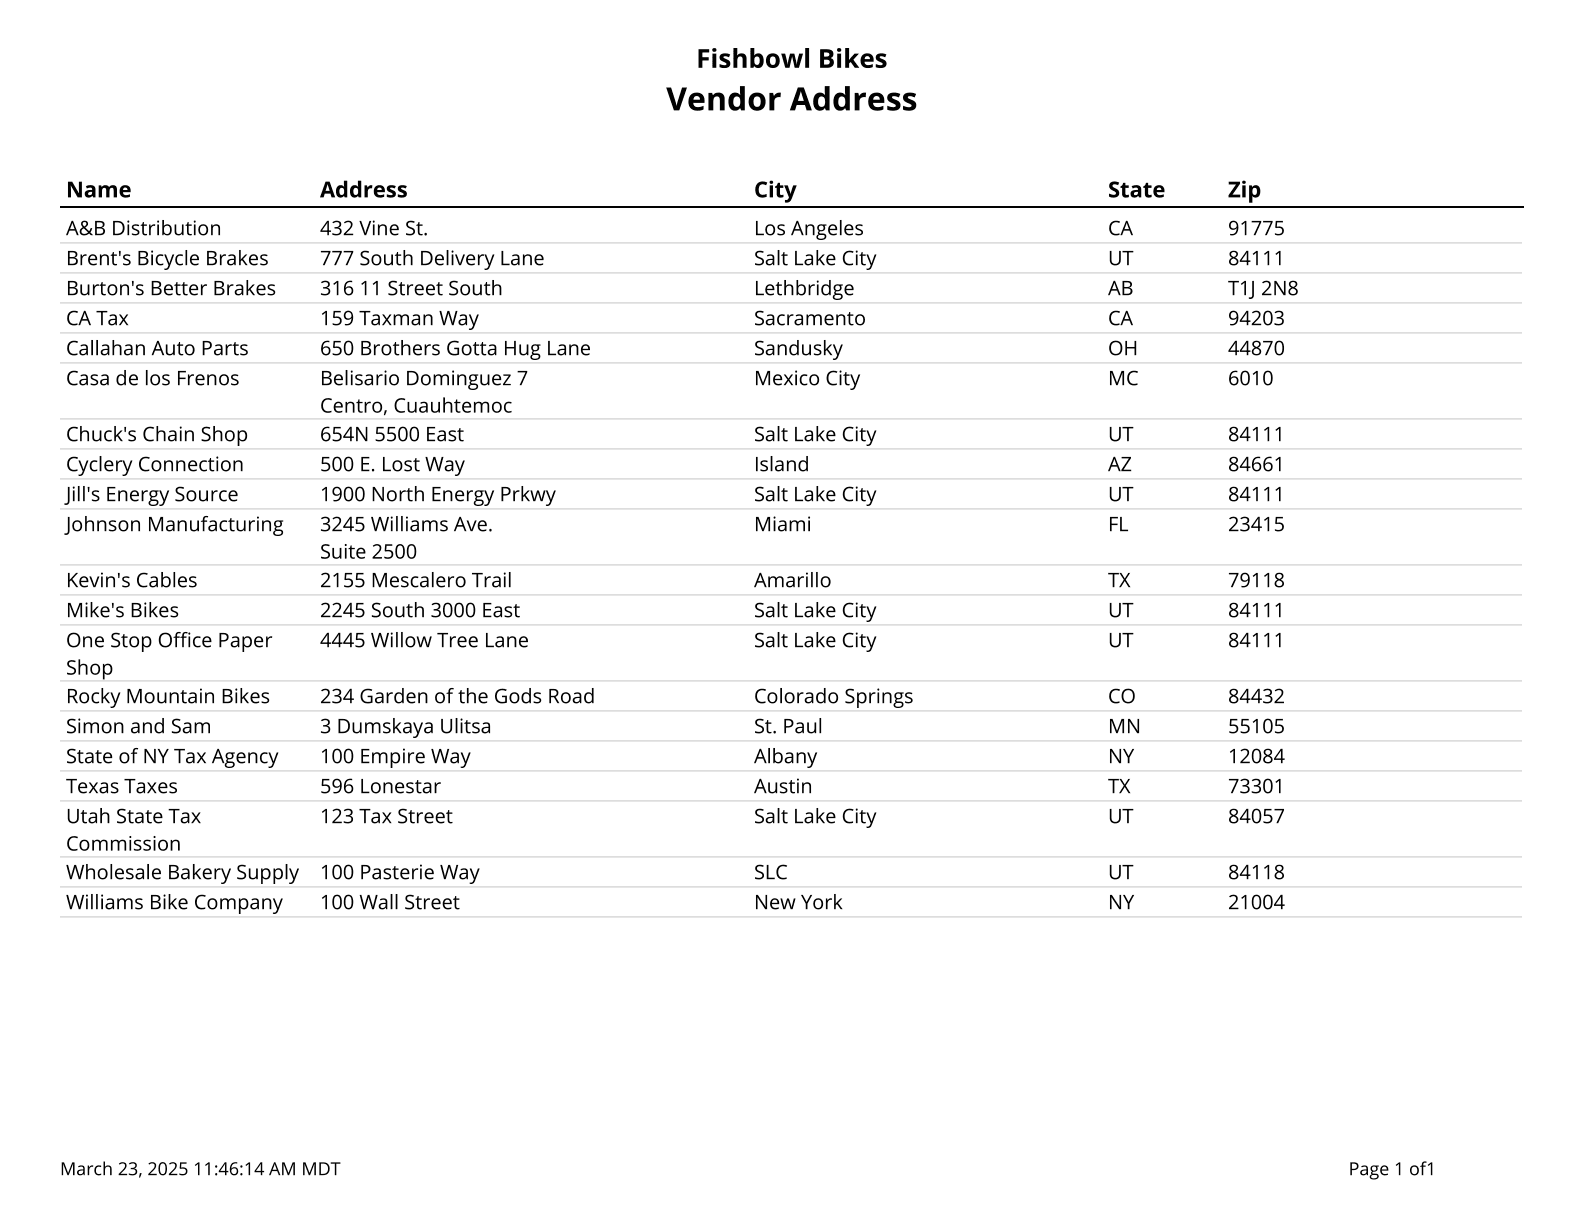
Vendor Address - A list of Vendors and Addresses.
Vendor Address List - Prints a list of vendors with addresses of a given type.

Vendor Backorder Report - Prints a list of parts where the scheduled fulfillment date has passed. Filtered by vendor, part, and/or date range. Grouped by vendor, part, or PO number.

Vendor Fulfillment History - A part-by-part list of vendor fulfillments on purchase orders. Filtered by location group, vendor, and/or part.

Vendor Part List - Lists all parts sold by a vendor, as well as the date and unit cost of the last purchase made.

Vendor Performance Report - Gives a part-by-part list of vendor fulfillments on purchase orders received during a date range, vendor, and/or part.

|
| Work Order
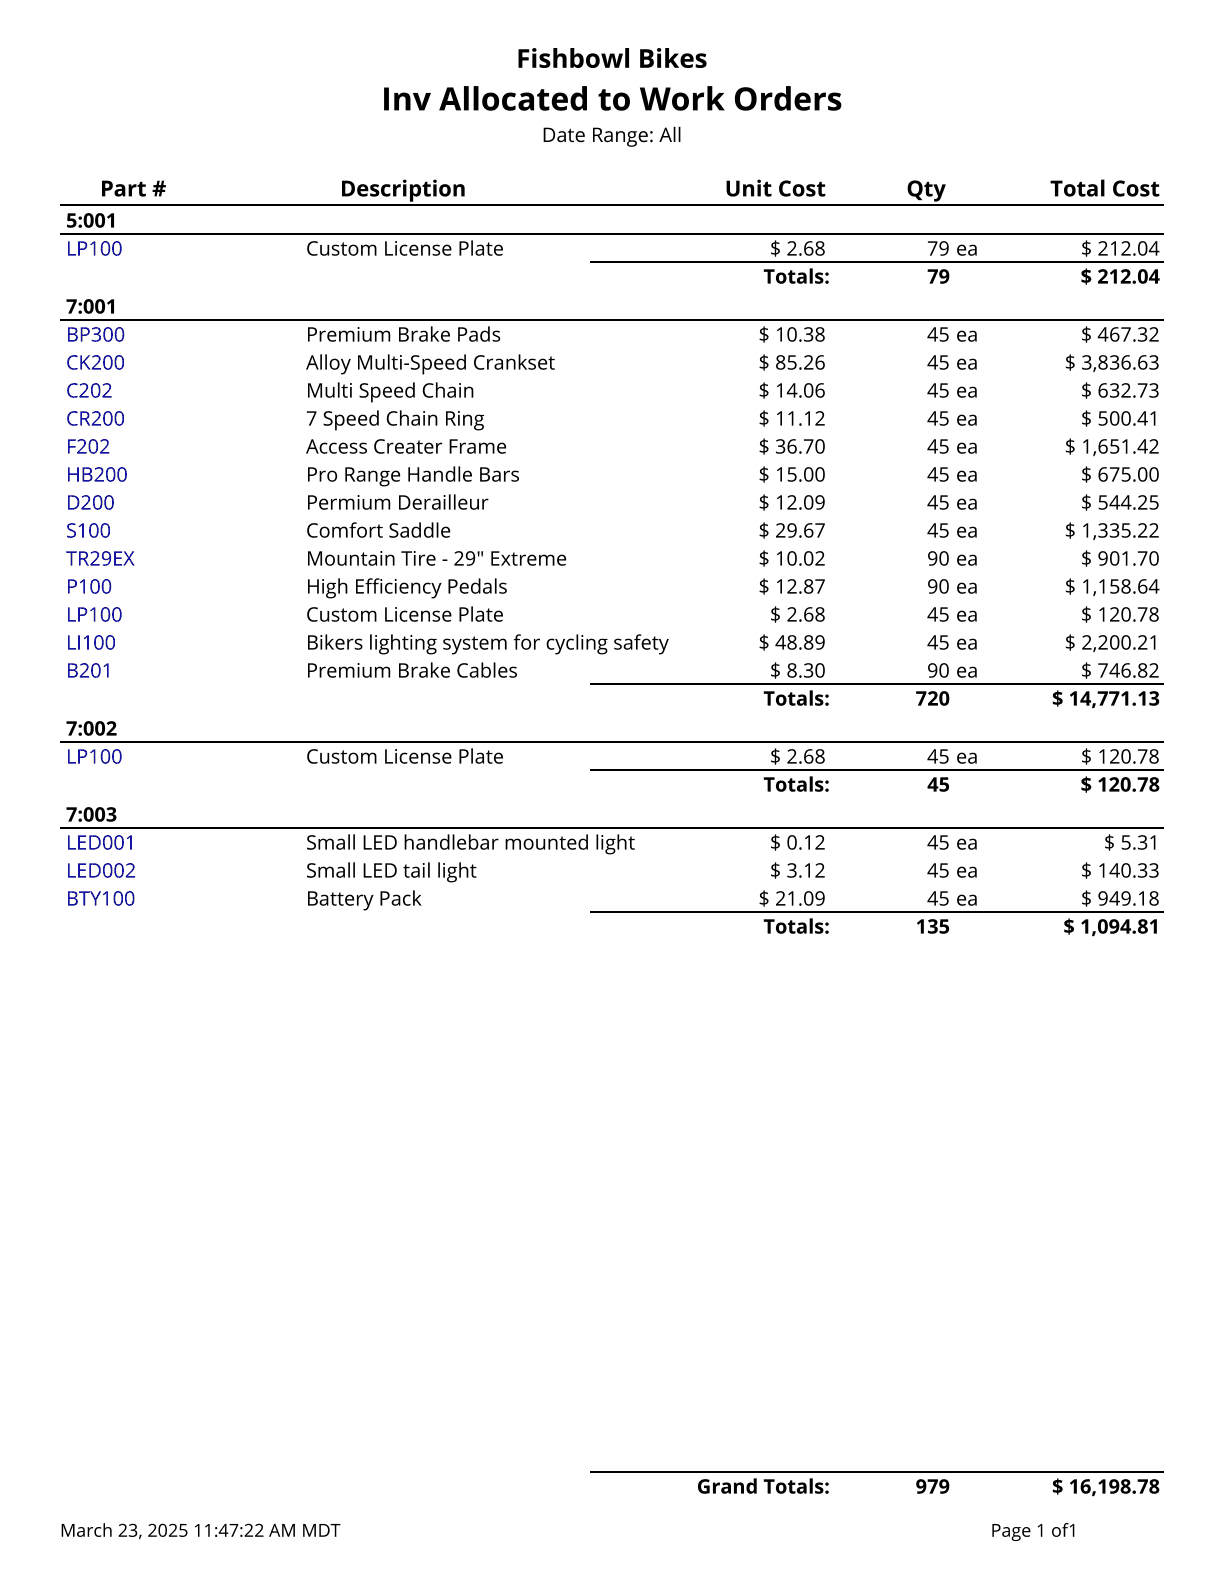
Inventory Allocated To Work Orders - Creates a list of all inventory currently allocated to outstanding work orders. Cost values are based on today's costs.
Outstanding Work Orders - Prints a list of all outstanding work orders, along with their associated sales order number and customer (if any).

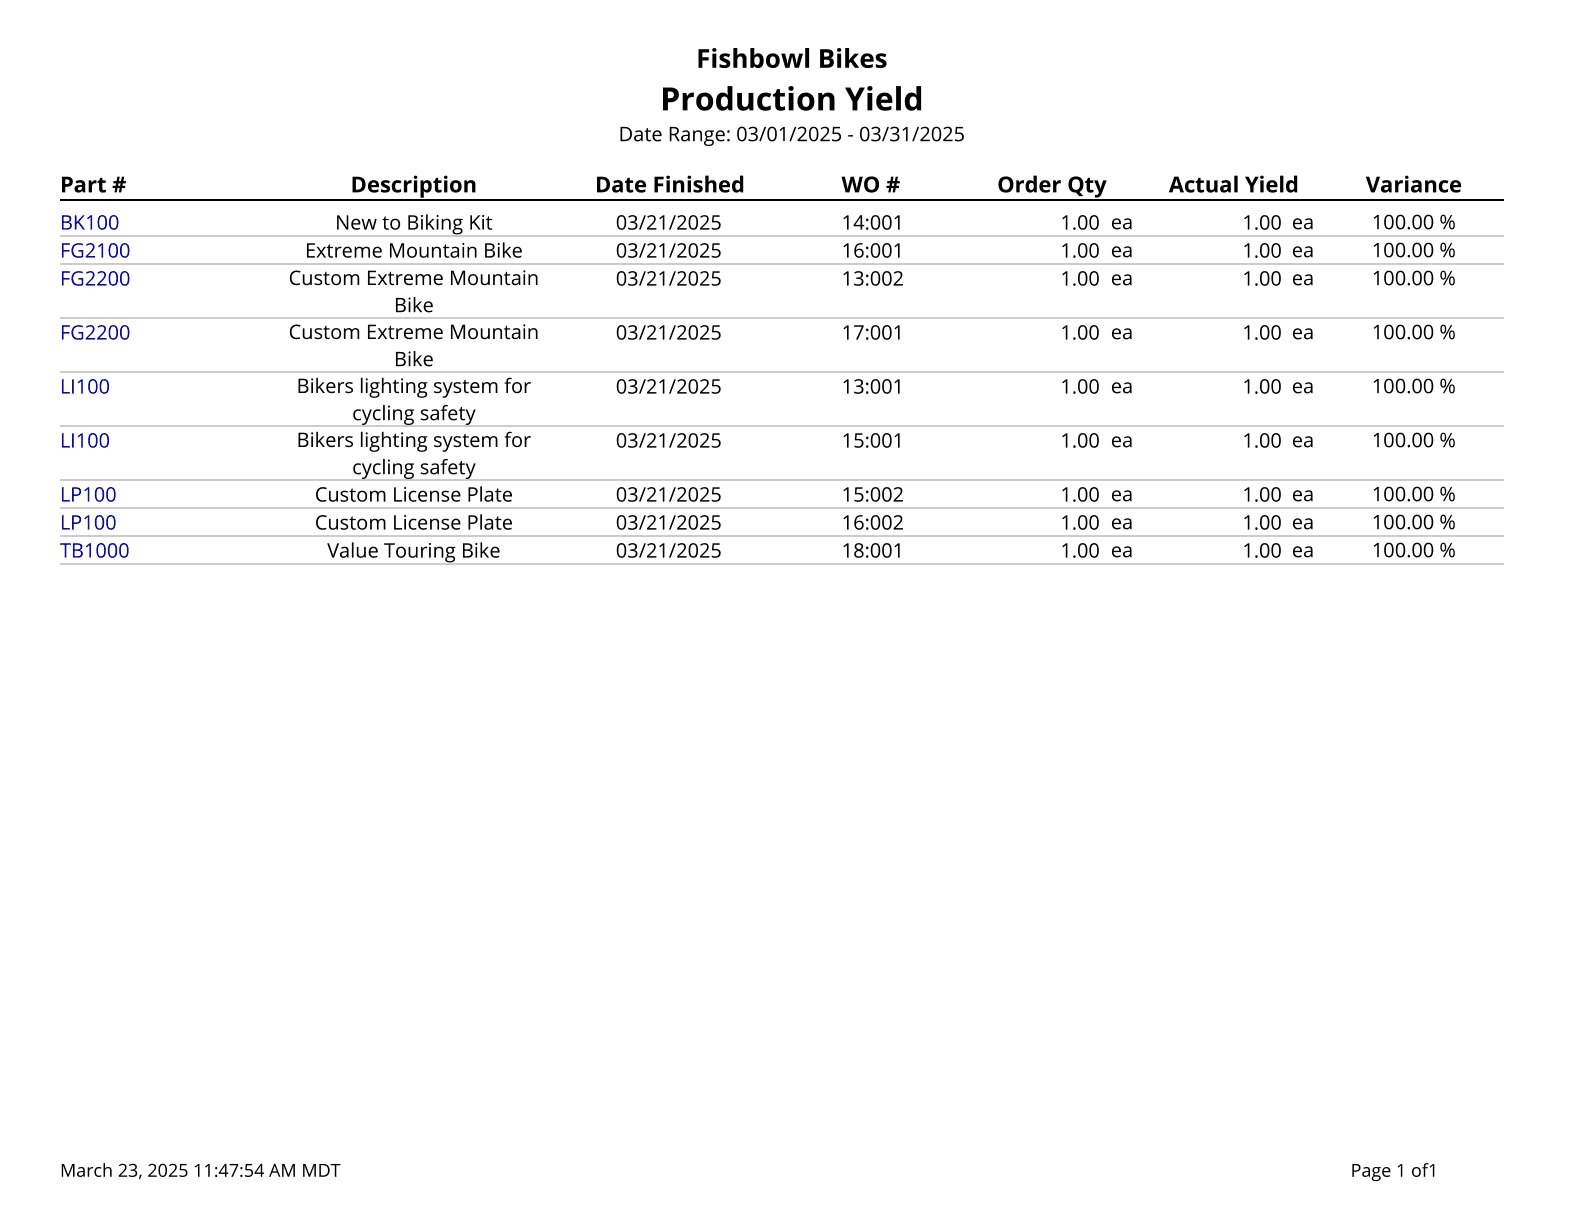
Production Yield - Shows a list of parts manufactured with the yield percentage per work order.
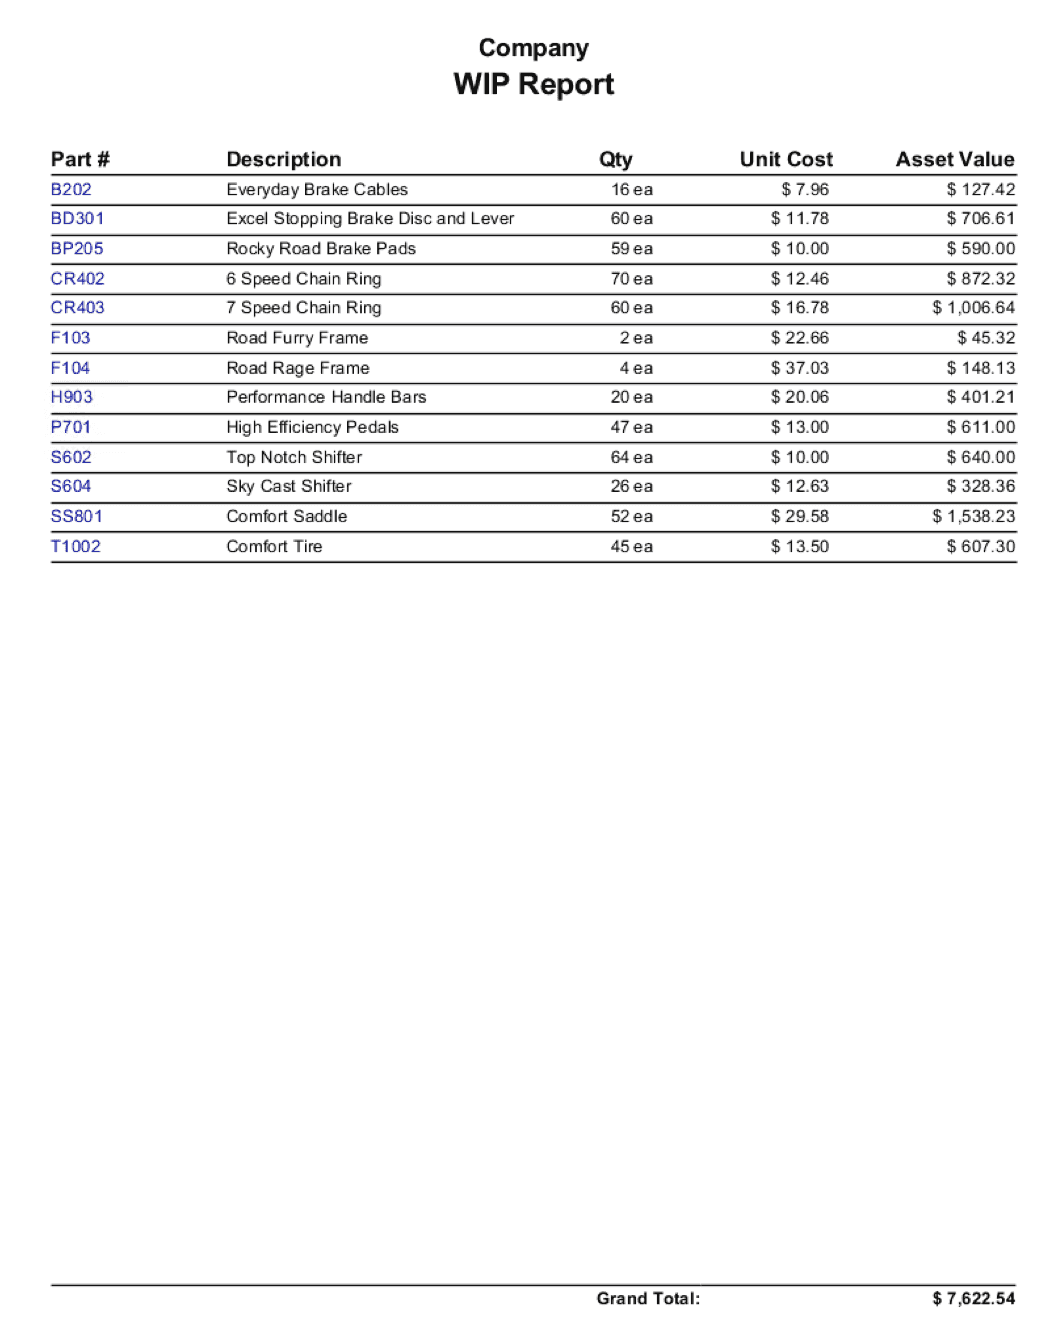
Work In Progress - Generates a WIP summary of the quantity and value of all parts currently in manufacturing locations. Cost values are based on today's costs.
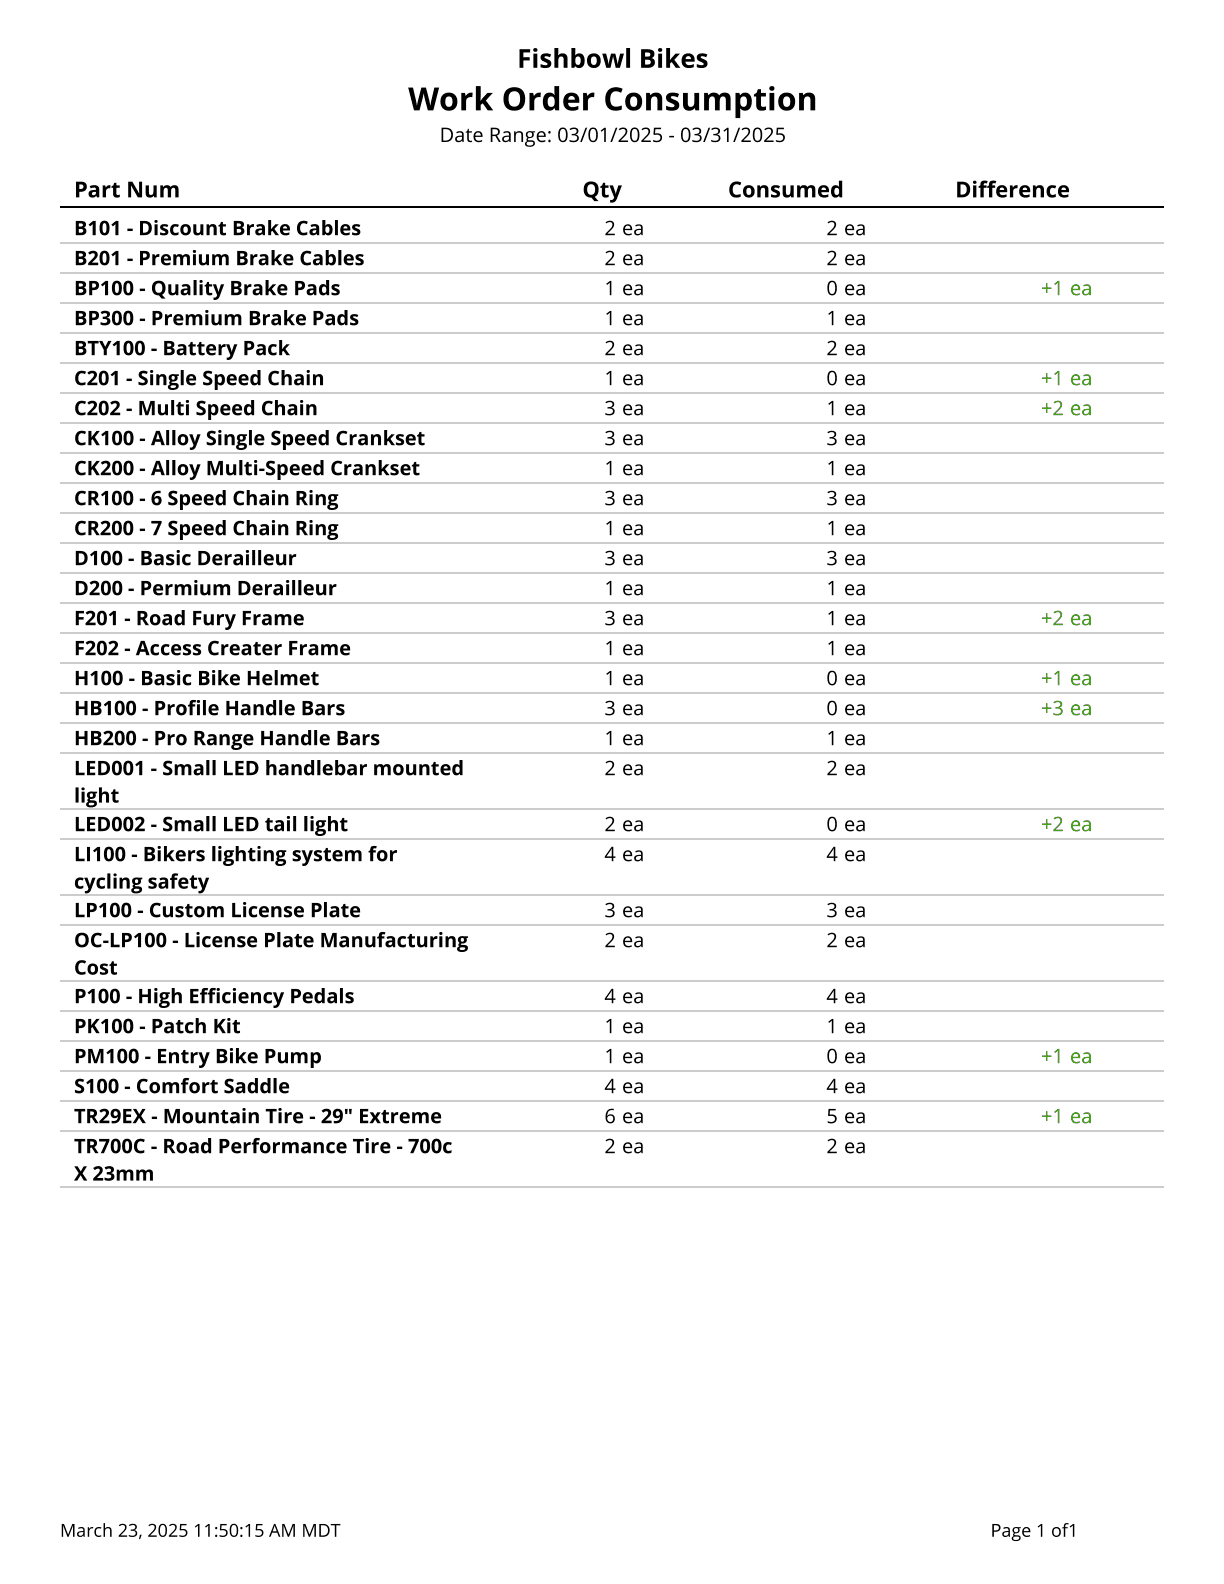
Work Order Consumption - Prints out the consumption of fulfilled work orders.
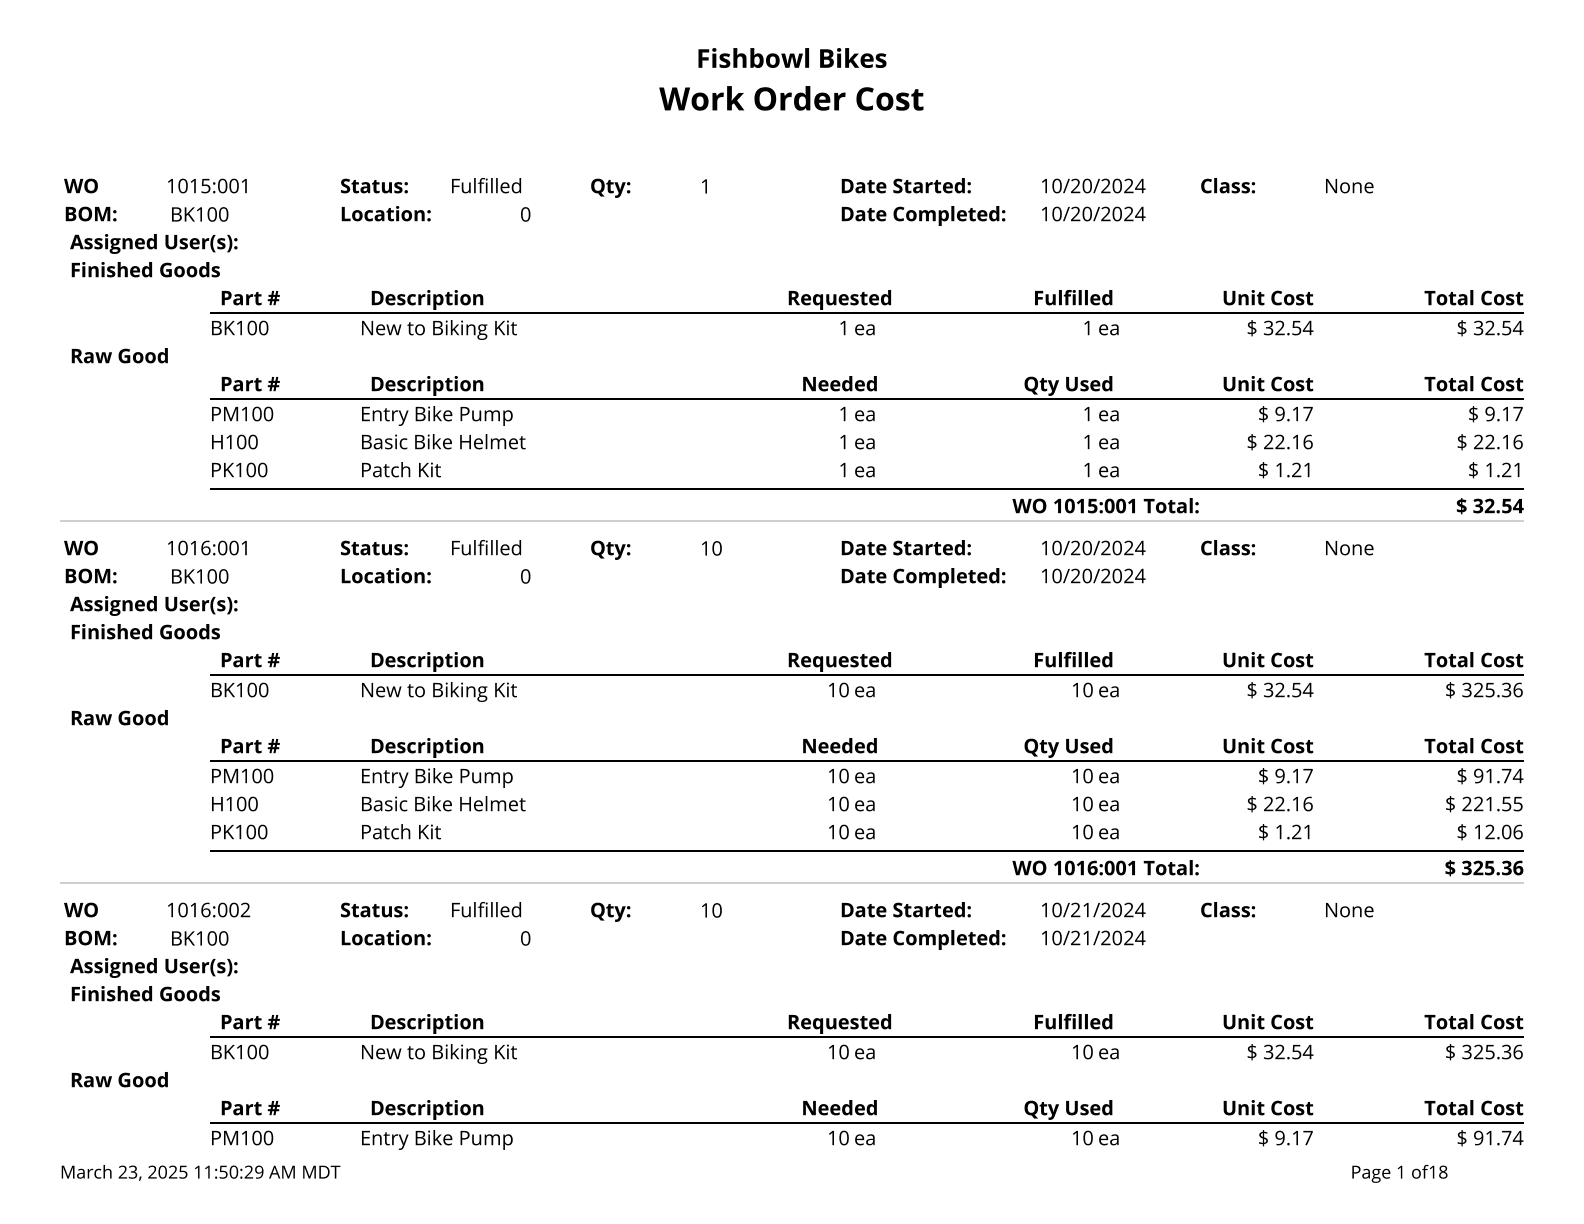
Work Order Cost - Displays the work order cost amounts and work order items. The cost of unfulfilled work orders is based on your database costing method. Fulfilled work order costs are your historical cost for the work order.
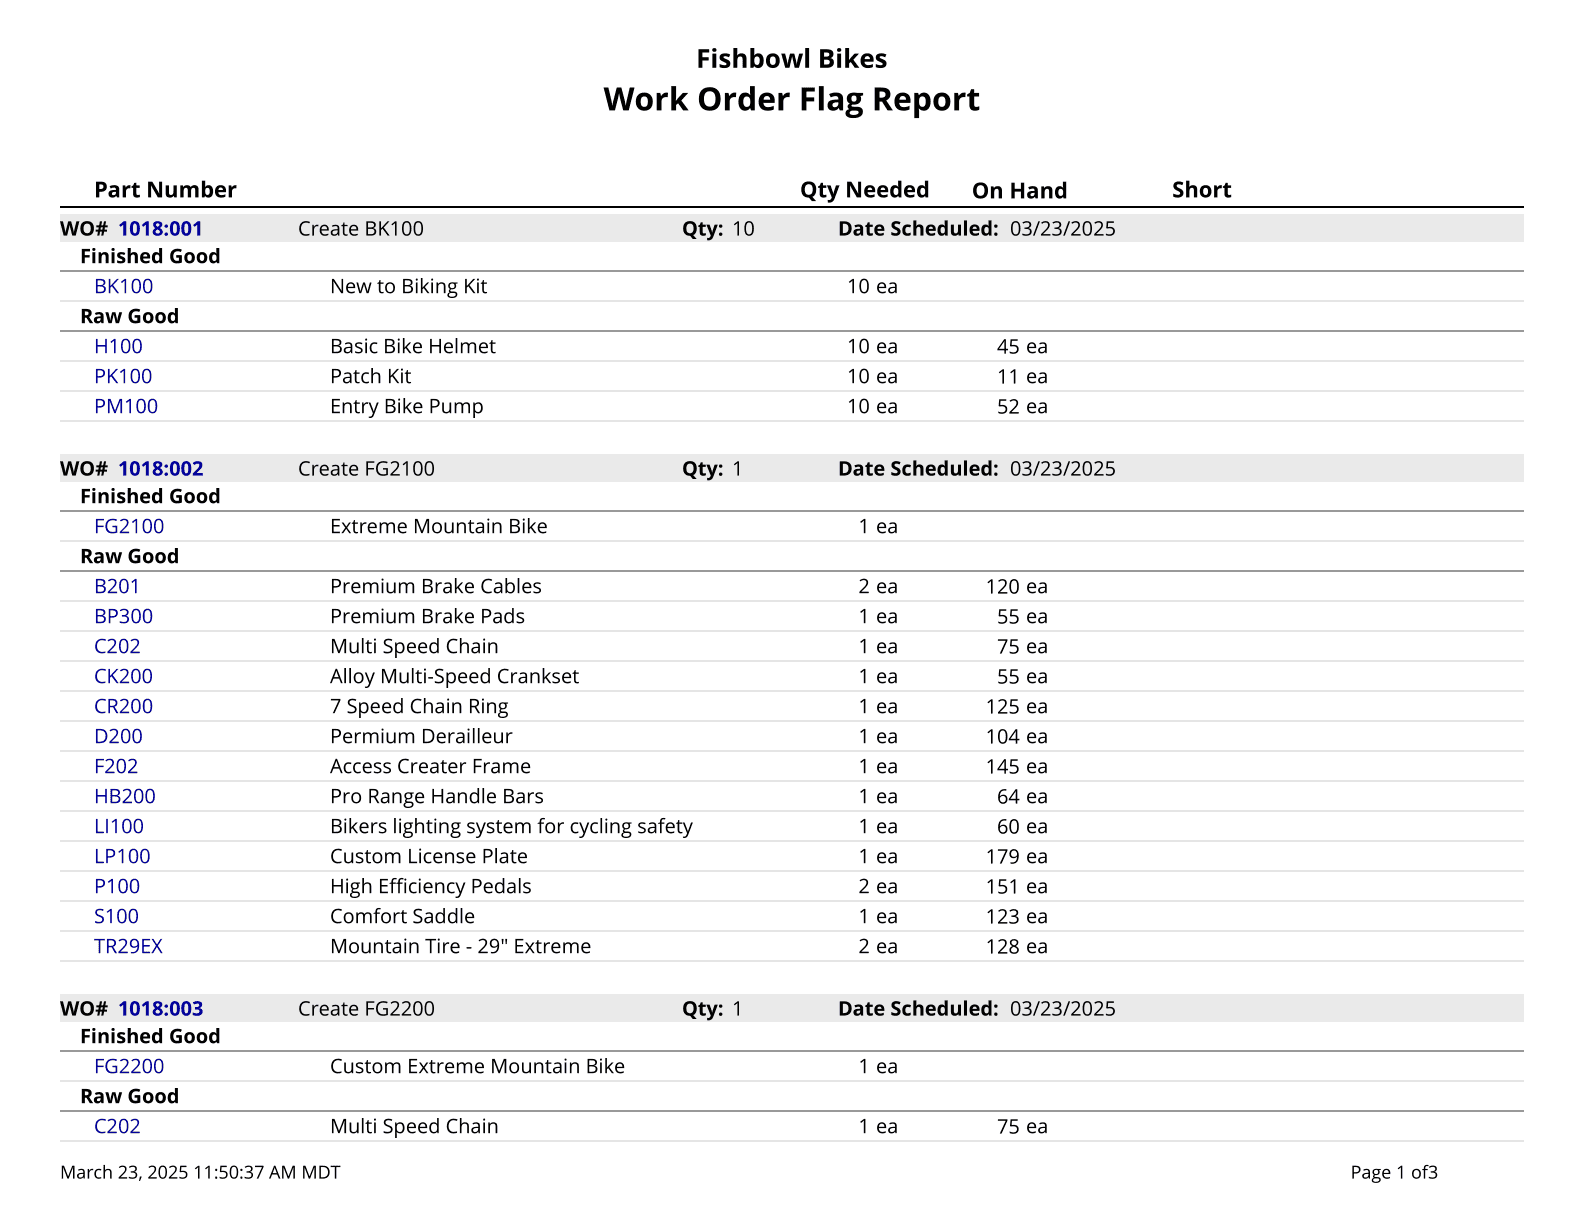
Work Order Flag - Prints a list of work orders that have been issued and not started. Use % for a wildcard search.
Work Order Instructions - Prints a list of instructions for completing a WO.

Work Order Report - Printout of Work Order Details.
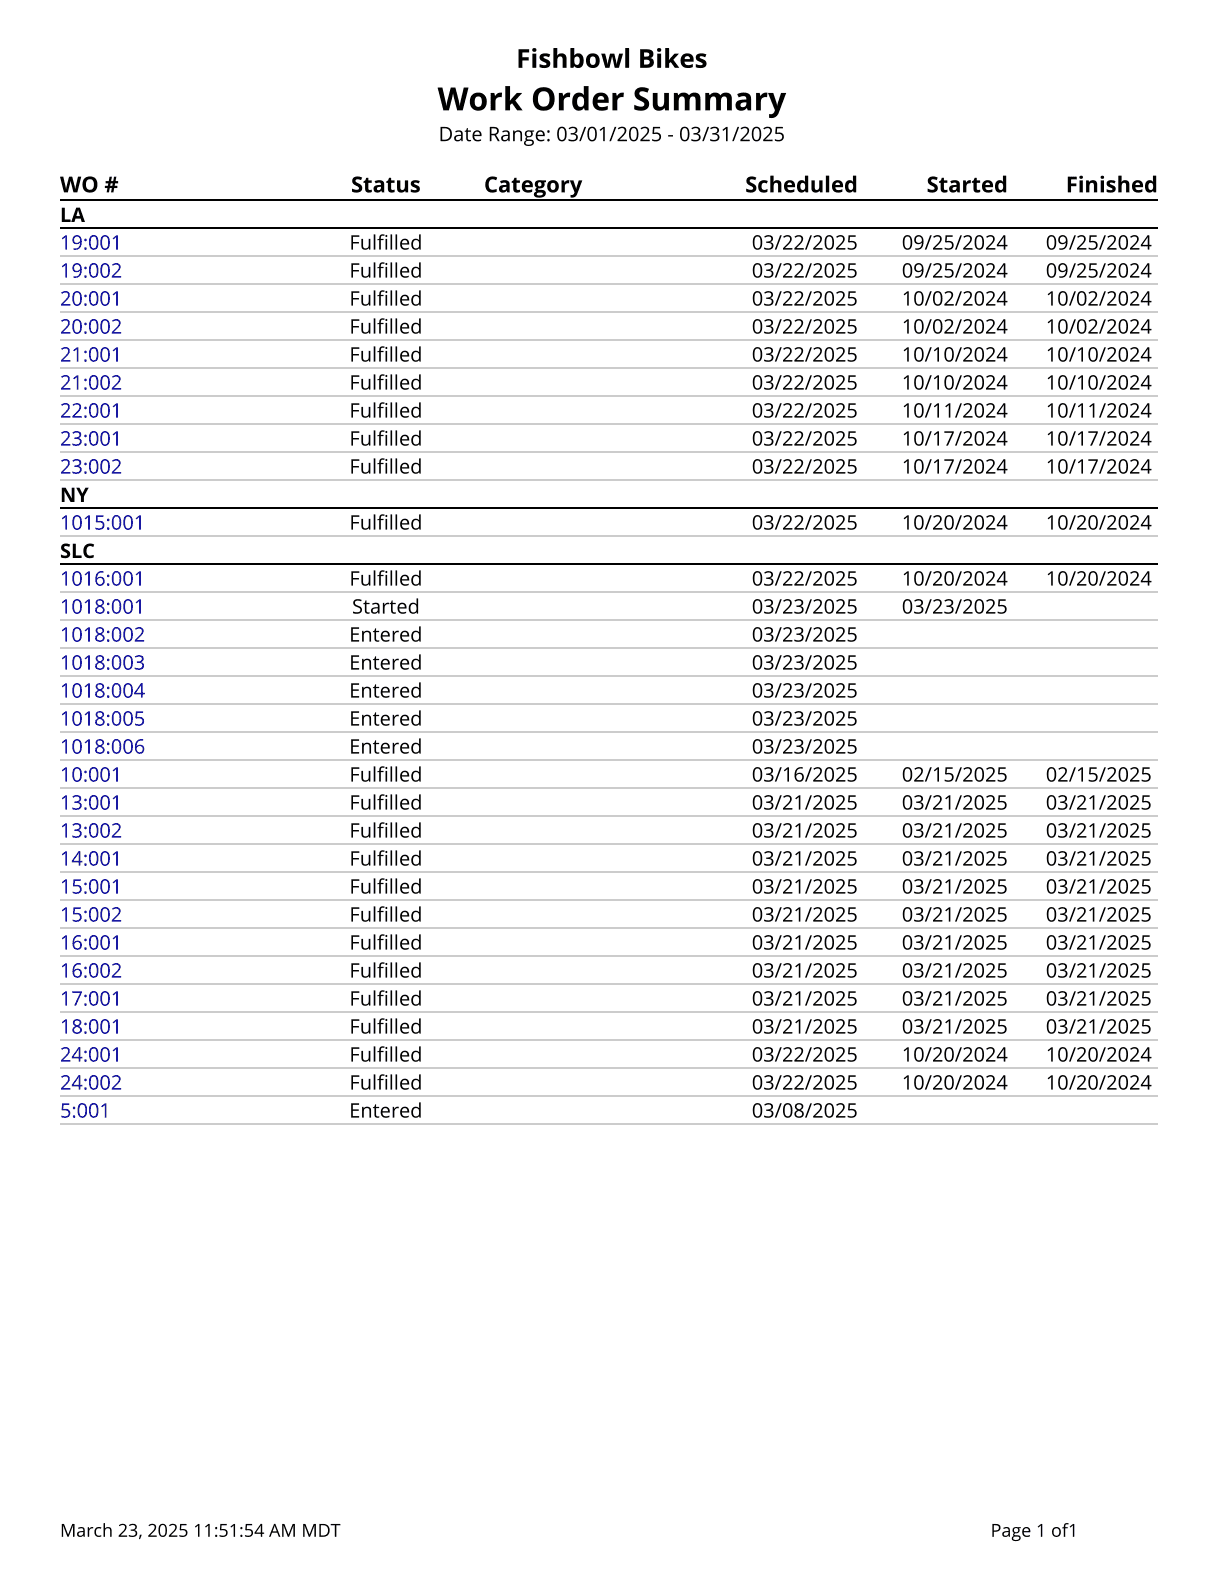
Work Order Summary - Lists parts on outstanding work orders by location group and work order number.
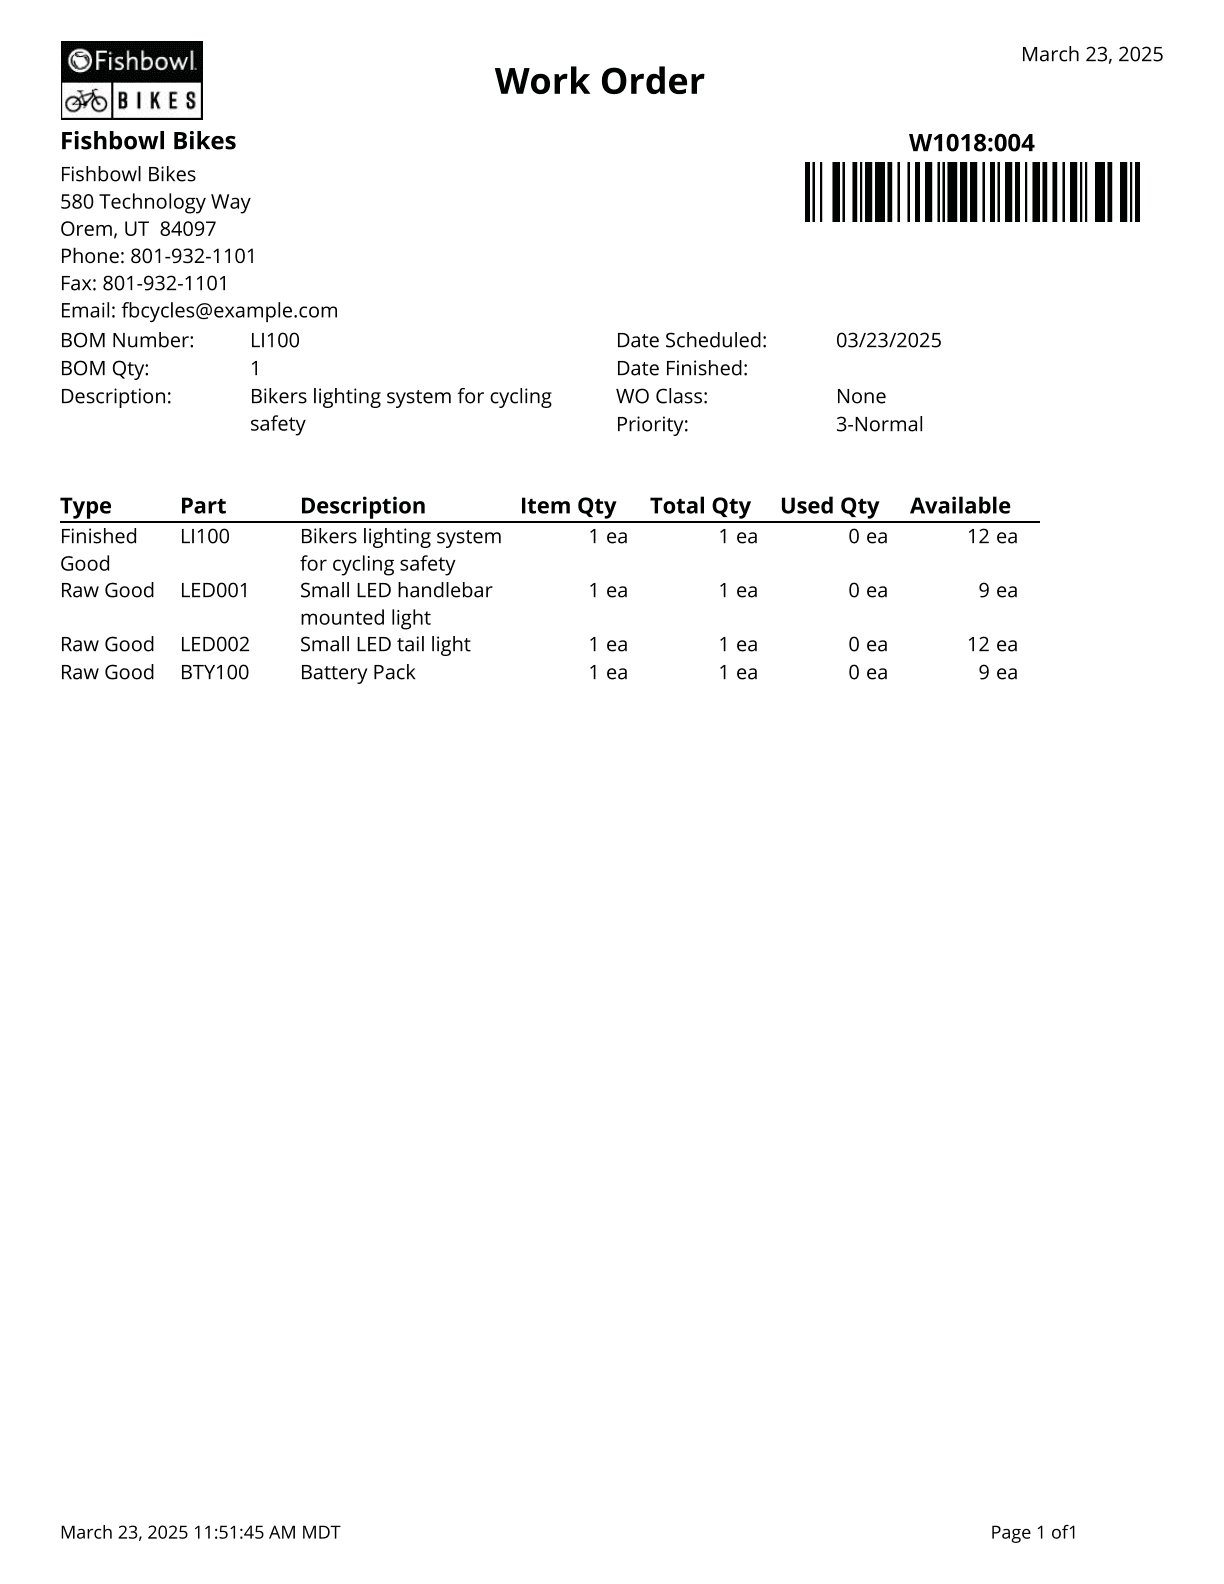
Work Order Traveler - Basic Report for Work Orders.

|
 The Reports module, located in the
 Upload allows a report file to be uploaded.
 Update allows an existing report to be re-uploaded.
 Save will save any changes made to the report.
 Delete will delete the report if it is not read-only.
 Duplicate creates a copy of the report that can be renamed and modified.
 Request opens a window to request a custom report from Fishbowl.
 Server Log opens a window with technical information about recent server activity. This information can then be sent to Fishbowl.
 Email opens a window to compose an email. If the module's default report is specified, the PDF report will be attached. Email can be configured on the Email tab of the
 Print sends the default module report to the printer.
 How To opens this article in a web browser.
 Refresh reloads whatever is currently open in the module.



















































































































































